October 2021 Catalina Island Visitor Stats
All Arrivals
October visitation increased year-over-year, resulting in an overall increase by 19% or 13,501 visitors over the same month last year.

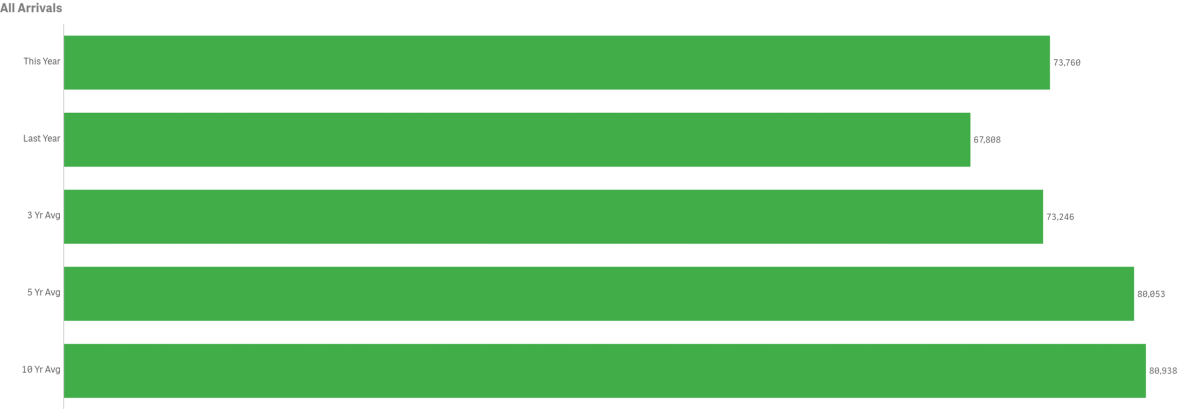
Previous October tracking (below) offers a comparison without COVID-19 impacts. October 2021’s total of 73,760 fell short of October 2019’s total arrivals of 78,170.
October’s total in-bound passenger count was slightly above the three-year average of 73,246 but below the five and ten-year averages of 80,000. October 2021 trailed the same month in 2018 by 11,372 visitors but exceeded 2019 by 3,978.
Arrivals by Sea
Passengers arriving by sea, including private boaters, totaled 70,560 for the month of October, up by 8.4% or 5,441 from last year.


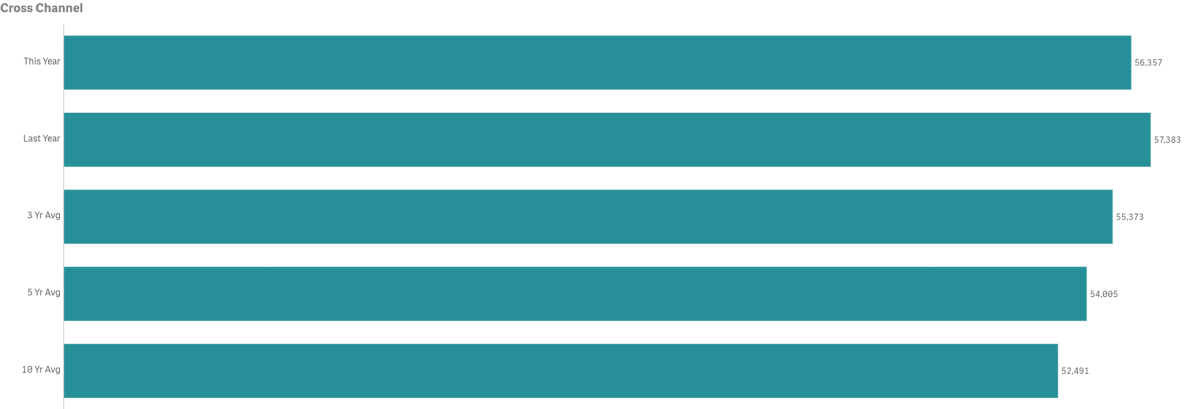
- October Cross Channel Passenger counts were down slightly year-over-year @ -1.8% or 56,357 vs 57,383 in 2020
- 2021 had the highest volume for the month @ 57,383 passengers
- 2009 had the lowest volume for the month @ 31,323
- 2019 had 52,375 Cross Channel Passengers or 3,900 fewer passengers than 2021
- October Cross Channel Passenger counts were above the three, five and ten-year averages by 1.8%, 4.4% and 7.4% respectively
- Cross Channel Passengers made up 76.41% of total monthly arrivals
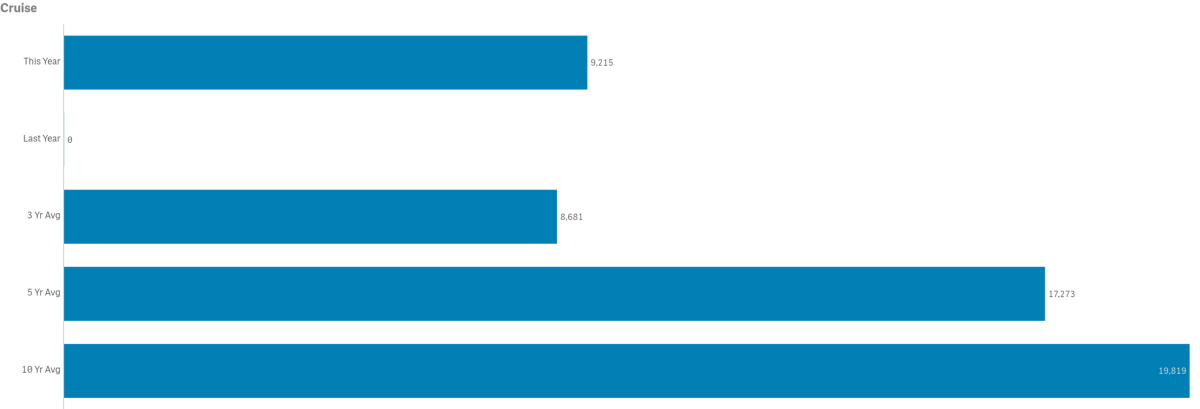
- Cruise passenger counts were 9,218
- 2005 had the highest Cruise Passenger volume for the month @ 34,973
- 2020 had the lowest Cruise Passenger volume for the month @ 0. Pre-COVID-19 low was 2010 @ 11,103
- 2019 had 16,828 Cruise Passengers
- October Cruise Passenger counts were above the three-year average of 8,583 (includes 2020 with 0 passengers) by 6.2%
- October Cruise Passenger counts were below the five-year average of 17,273 (includes 2020 with 0 passengers) by 46.5%
- October Cruise passenger counts were below the ten-year average of 19,819 (includes 2020 with 0 passengers) by 53.5%
- Cruise Passengers made up 12.5% of total monthly arrivals
- The number of Cruise Ships calling on Avalon was 8
- 2017 had the largest number of ships @ 13
- A typical October has averaged 10 ships visiting
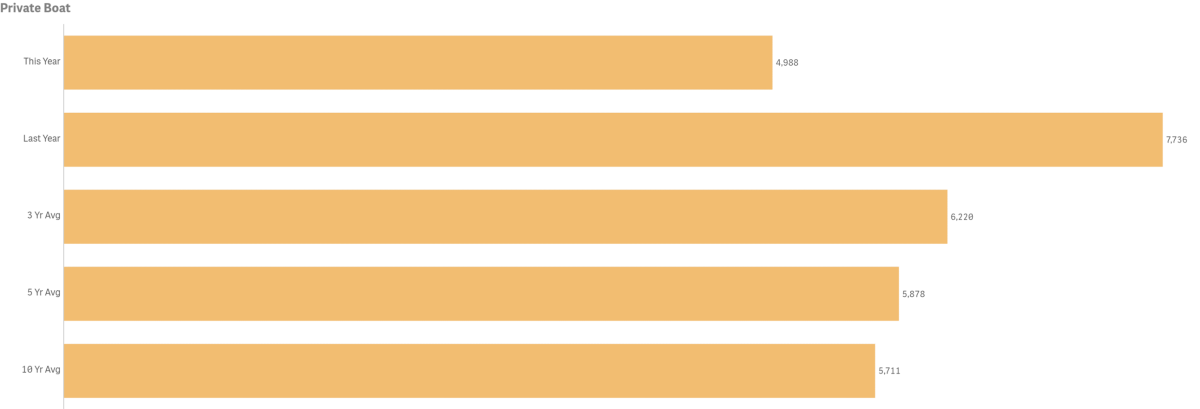
- Private Boater Passenger counts were down year-over-year @ 4,988 vs. 7,736 in 2020
- 2020 had the highest passenger volume for the month @ 7,736
- 2012 had the lowest passenger volume month @ 4,800
- October Private Boater Passenger counts were below the three, five and ten-year averages by 35.5%, 19.8% and 15.1% respectively
- October’s number of Vessels Anchored was down @ 64 vs.103 last year
- 2018 had the highest number of Vessels Anchored @ 252
- 2011 had the lowest number of Vessels Anchored @ 10
- October 2021 was below the average number of Vessels Anchored for three, five and ten-year averages by 8%, 35.6% and 102% respectively
- October’s number of Vessels on Moorings was down 35.5% @ 1,237 vs. 1,934 last year
- 2020 had the highest number of Vessels on Moorings @ 1,934
- 2012 had the lowest number of Vessels on Moorings @ 1,200
- Private Boaters Made up 6.76% of total monthly arrivals
Arrivals by Air
Combined in-bound air passenger counts for October totaled 3,271, up from 2,791 in 2020.
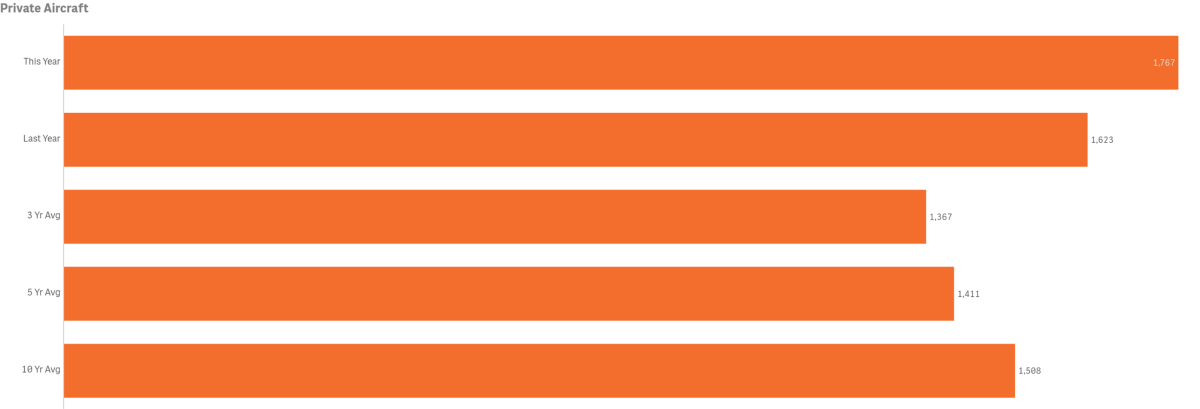
- Private Aircraft Passengers (Airport in the Sky) was up @ 1,767 from 1,623 last year
- 2011 had the highest volume of Private Aircraft Passengers for the month @ 1,777
- 2018 had the lowest volume of Private Aircraft Passengers for the month @1,161
- October counts Private Aircraft Passengers was above the three, five and ten-year averages of 1,655, 1,498 and 1,531 by 6.8%, 17.9% and 15.4% respectively
- October Private Aircraft Passengers made up 2.4% of total monthly arrivals
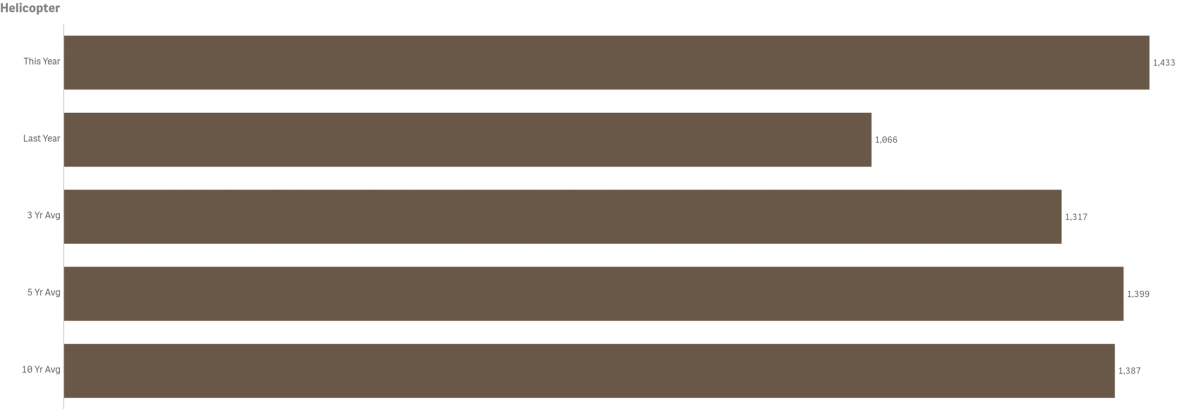
- Helicopter Passenger counts were up 34.4% year-over-year @ 1,433 vs. 1,066
- 2015 had the highest volume for the month @ 1,617
- 2011 had the lowest volume for the month @ 872
- October counts for Helicopter Passengers was above the three, five and ten-year averages of 1,317, 1,399 and 1,387 by 8.8%, 2.4% and 3.3% respectively
- October counts for Helicopter Passengers made up 1.94% of total monthly arrivals
Year-to-Date
Total year-to-date arrivals are up from last year by 55%. Keep in mind that current and multi-year figures include impacts of COVID-19 from present back to March 2020.

- Total Arrivals year-to-date was up from last year @ 703,908 vs. 454,135 or a difference of 249,773 visitors
- Total Arrivals year-to-date exceeded the three-year average of 684,188 by 2.9%
- Total Arrivals year-to-date were below the five and ten-year averages of 789,200 and 820,643 respectively
- All arrival sectors are up year-to-date with the exception of Cruise
Year-to-Date--Historical
Pre-Covid-19 comparison data is illustrated below.

- Due to COVID-19 impacts, 2020 had the lowest year-to-date total visitation @ 454,135
- 2017 had the highest total visitation year-to-date @ 955,821
- Compared to 2017, 2021 year-to-date total arrivals are down by 251,913
- 2019 had 894,520 visitors year-to-date
- Compared to 2019, 2021 year-to-date total arrivals are down by 190,522 people
- Cross Channel Passengers are just above 2019 year-to-date counts
- All arrival sectors are up 2021 year-to-date compared to 2019 with the exception of Cruise
To view historical data for total arrivals by sector, year and month in a spreadsheet form click here. PDF File.
Visitor Services
October Visitor Services varied up and down by measure year-over-year.
Catalina Island Visitor Center

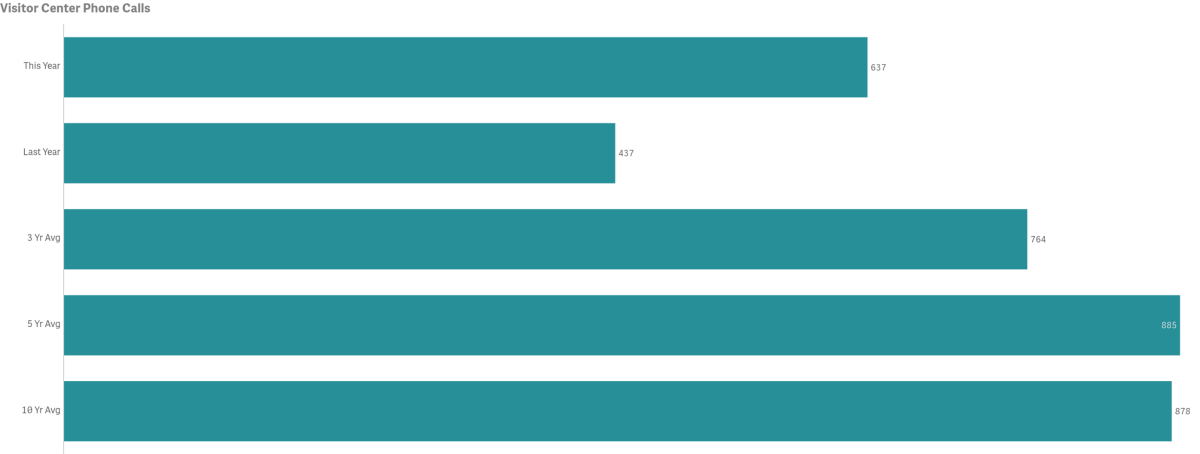
- Number of Phone Calls for the month was up year-over-year by 45.8% @ 637 vs. 437
- 2014 had the highest volume for the month @ 1,485 calls
- 2020 had the lowest volume for the month @ 457 calls. Pre-COVID-19 lowest call volume was 2015 @ 462
- October call counts were below the three-year average of 764 by 16.6%
- Note that a change in New Year’s Eve Gala reservations (launched each year in August) from phone to online has resulted in significant reduction in 2021 phone calls. No New Year’s Gala tickets were sold in 2020
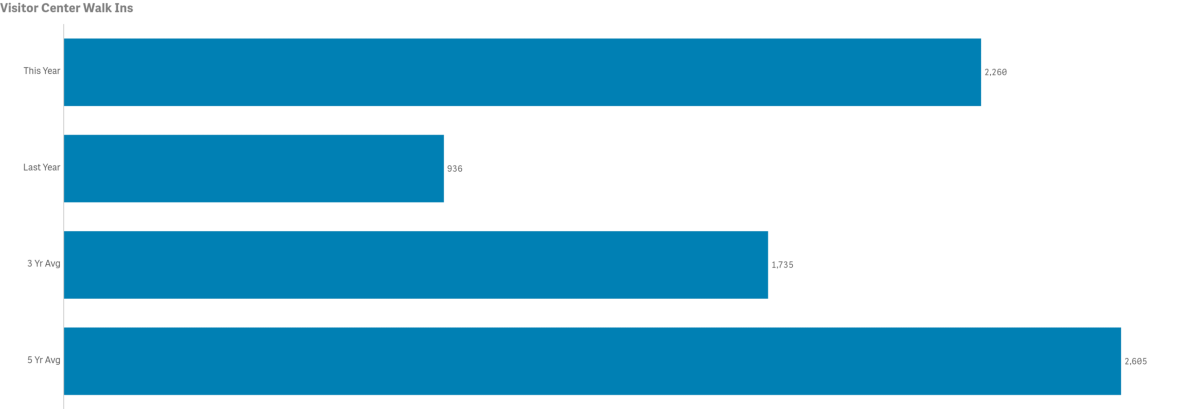
- Number of Walk-Ins for the month was up year-over-year @ 2,260 vs. 936
- 2016 had the highest volume of Walk-ins for the month @ 4,648 guests
- 2020 had the lowest volume of Walk-ins for the month @ 936 guests. Pre COVID-19 lowest volume of guests was 2019 @ 2009
- October Walk-In counts were above the three-year average of 1,735 by 30.3% and the ten-year average @1,767 by 27.9% but below the five-year average of 2,602 by -13.2%
- Note Walk-In traffic is greatly impacted by Cruise visits and October 2021 was the first full-month of ships calling on Avalon since February of 2020
LoveCatalina.com

- October LoveCatalina.com website users were down year-over-year by 9.2% @ 68,902 vs.75,846 in 2020
- Book Direct lodging searches were down year-over-year by 30.9% @ 8,872 vs.12,838 in 2020
- Note changes to Book Direct on member links has resulted in shifting more traffic to referrals vs. searches
- Book Direct referrals were down by 21.6% @ 8,028 vs.10,236 in 2020
- In 2020 a buy 2 get 3 nights program generated significant traffic to the site and to lodging searches

- Note above numbers do not include rack and visitor center distributions
- Printed Visitor Guide orders @ LoveCatalina.com @ 30, down from 530 or 94.3% from last year
- No 2021 Guide was printed
- Online Guide downloads were up by 115.4% @ 377 vs.175 in 2020
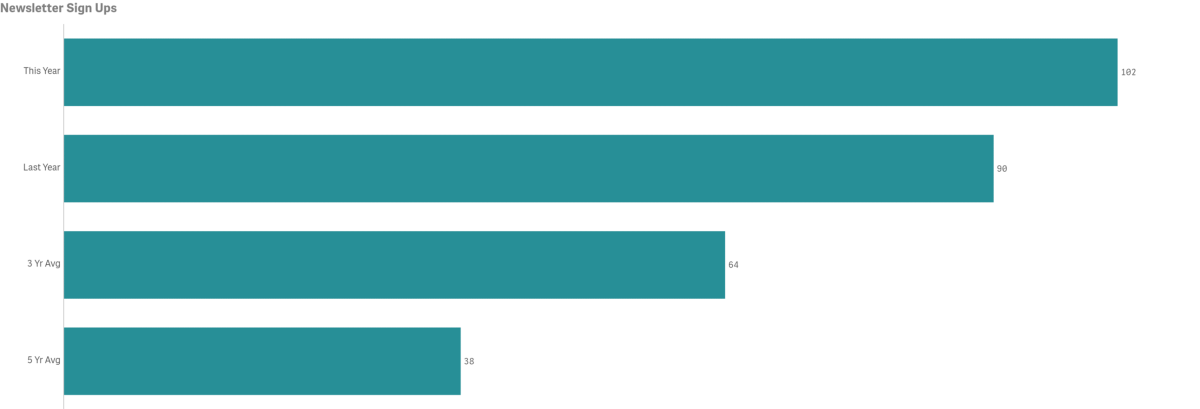
- New E-blast subscribers in October were up year-over-year @ 102 vs. 90 in 2020
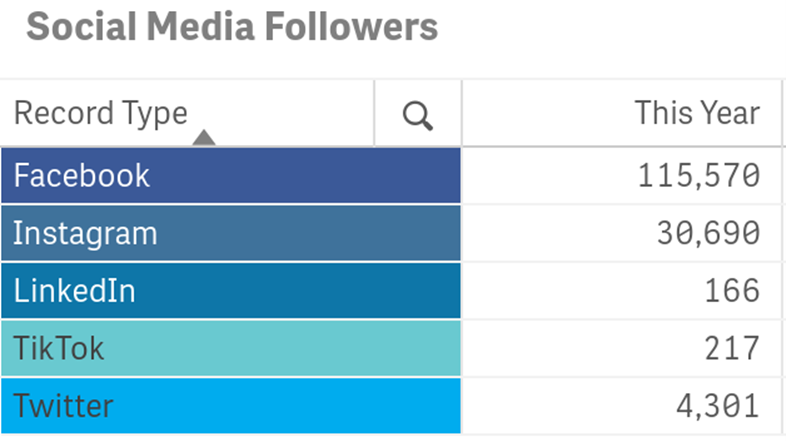
Social Media cumulative totals by platform as of October below.
Weather
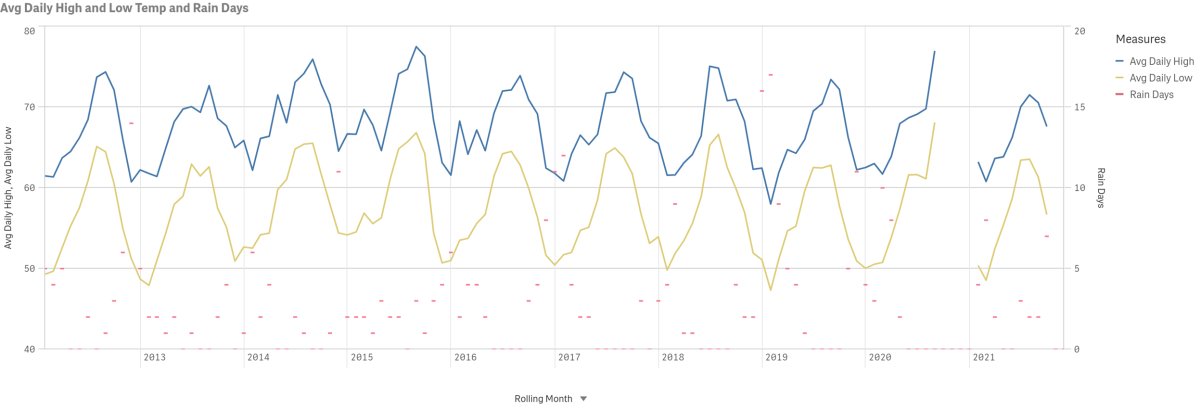
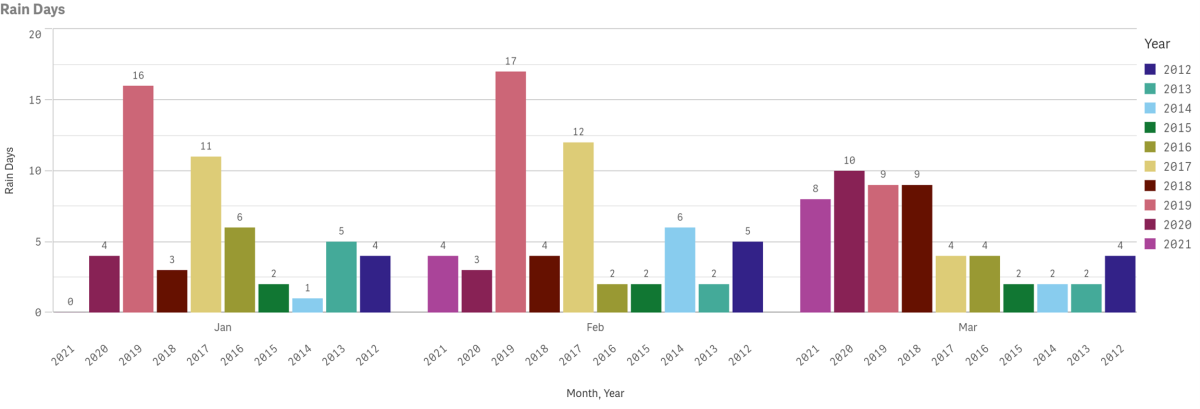
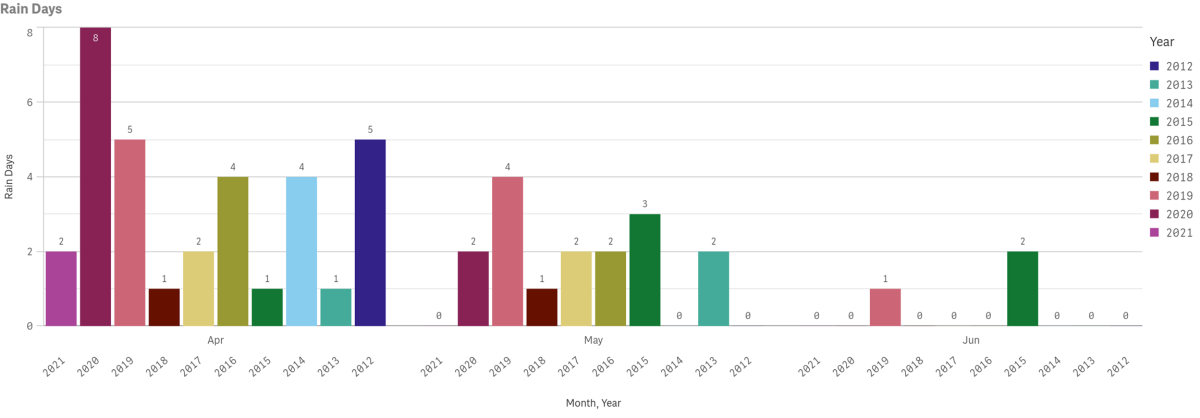
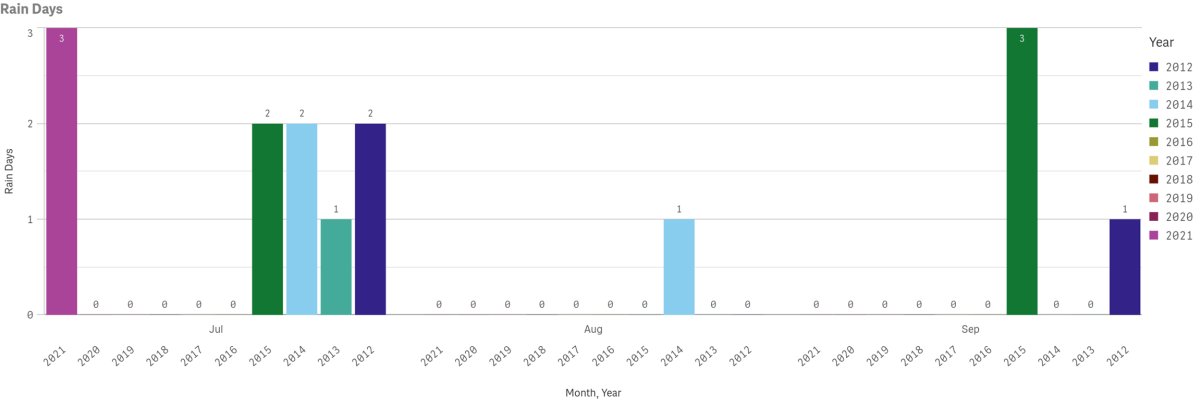
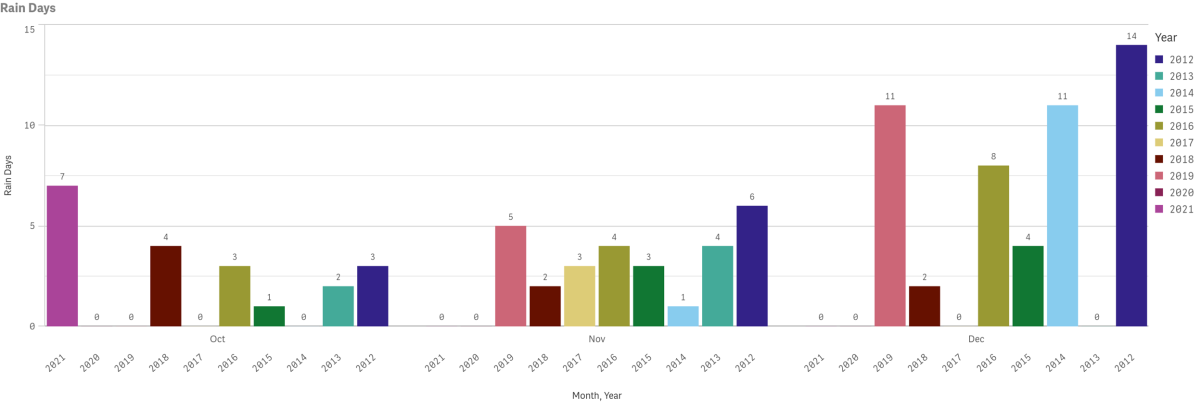
Data for October highs, lows and precipitation going back to 2012 is displayed below. Multi-year rain days data is also displayed by year and month. Measures are taken at Avalon Harbor.
Catalina Flyer from Newport
$10 Off Catalina Island Ferry
Hop onboard the Catalina Flyer for daily ferry service from Newport Beach to Avalon, Catalina Island in just over 1 hour.
Catalina Sea Spa
Recharge with massages starting at $110.
Discover Bliss at Catalina Sea Spa! Book online or call 310-510-8920. Treat yourself and escape to relaxation today!
