
August 2023
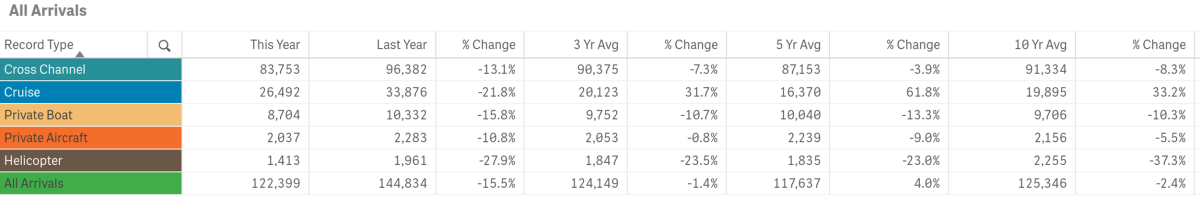
August visitation decreased year-over-year by 15.5% or 22,435 visitors. Tropical storm Hilary greatly impacted travel in August due to the evacuation warning issued by Los Angeles County resulting in trip cancellations for many visitors.
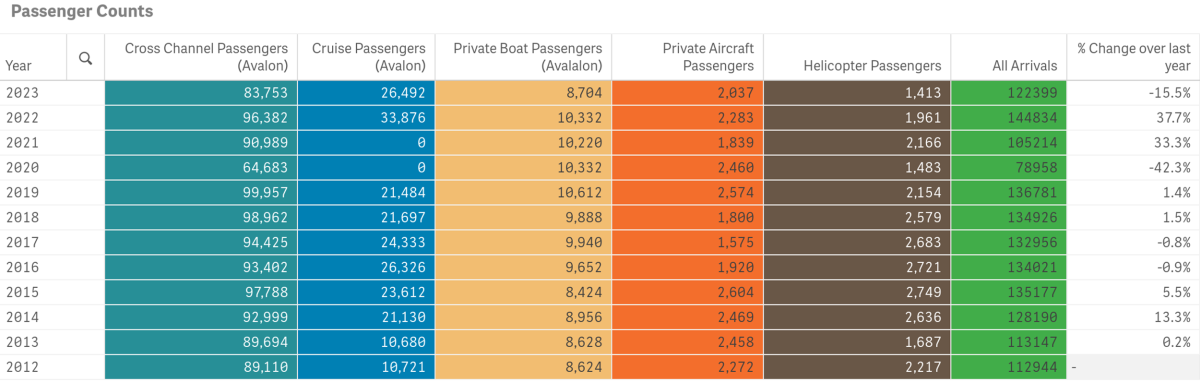
Previous tracking (below) for the month of August offers a comparison with and without COVID-19 impacts.
August’s total in-bound passenger count was below the three and ten-year averages for the month but above the five-year average. 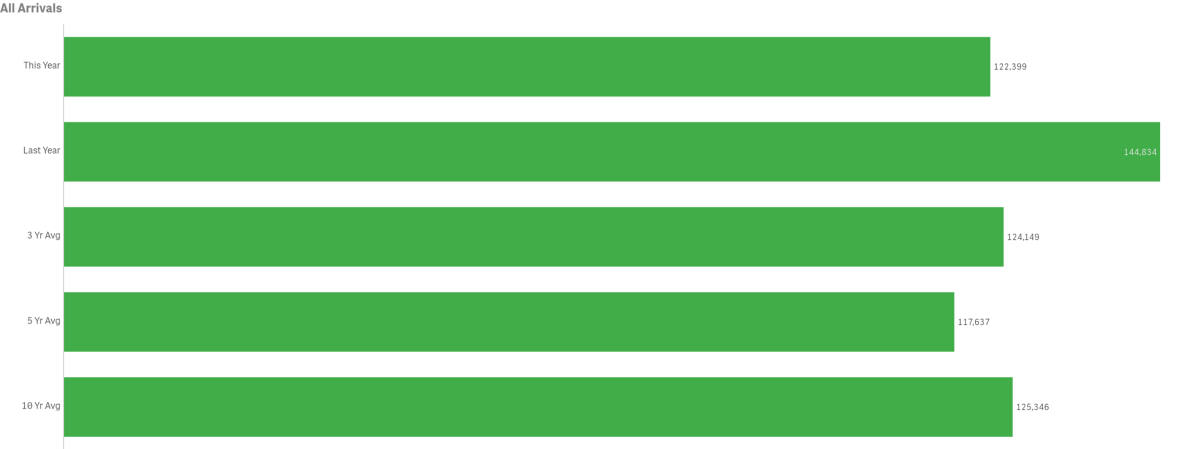
Arrivals by Sea
Passengers arriving by sea, totaled 118,949 for the month, a decrease of 15.4% from last year.
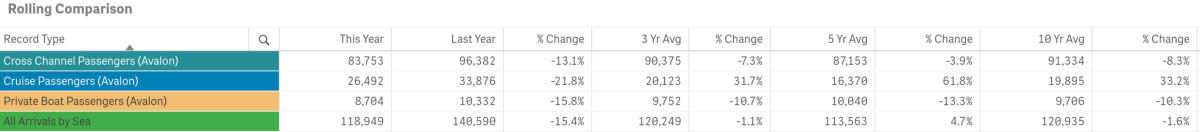
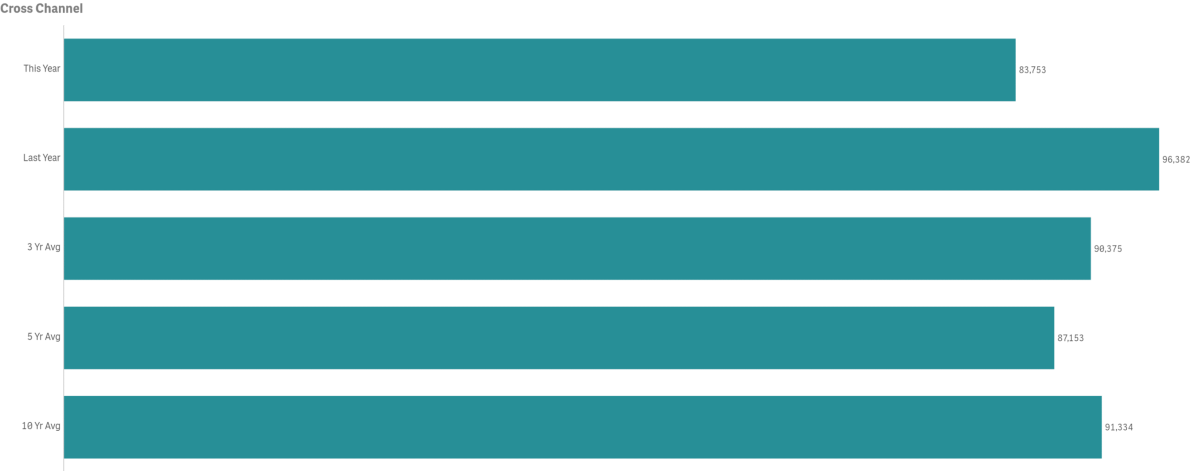
Cross Channel Passenger counts were down year-over-year by 13.1% or a decrease of 12,629 people
- 1990 had the highest volume for the month @ 121,064 passengers
- 2020 had the lowest volume for the month @ 64,683
- August Cross Channel Passenger counts were below the three, five and ten-year averages by 7.3%, 3.9% and 8.3% respectively
- Cross Channel Passengers made up 70.06% of total monthly arrivals
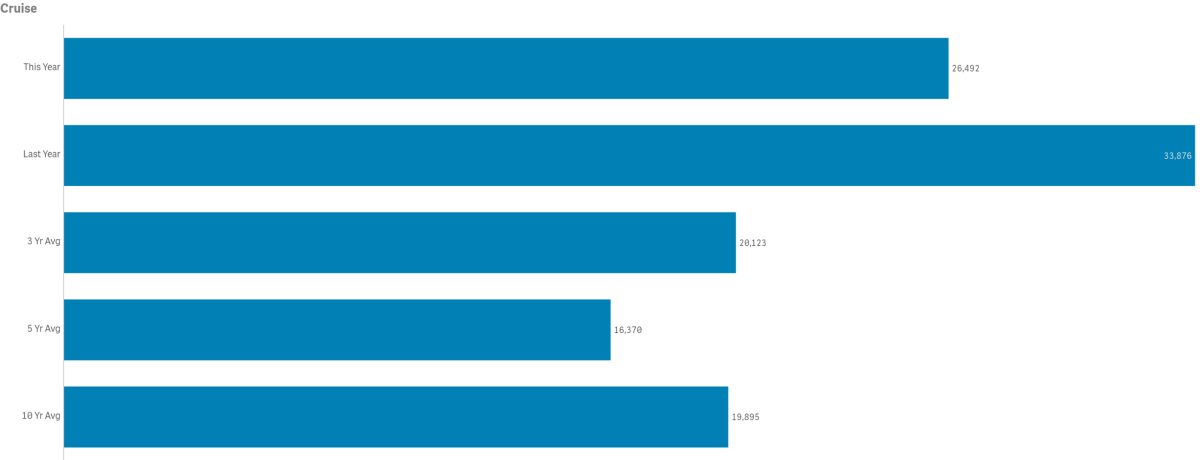
Cruise passenger counts totaled 26,492, down by 21.8% from 2022 or by 7,384 visitors
- 2022 had the highest Cruise Passenger volume for the month @ 33,876
- 2020 and 2021 had the lowest Cruise Passenger volume for the month @ 0
- August Cruise Passenger counts were above the three, five and ten-year averages by 31.7%, 61.8% and 33.2% respectively. Note multi-year averages are greatly impacted by the lack of cruise ships calling during COVID-19’s suspension of operations
- Cruise Passengers made up 21.64% of total monthly arrivals
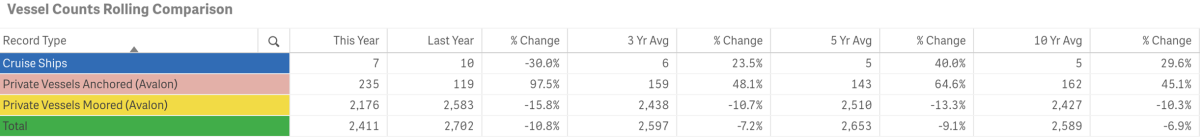
- The number of Cruise Ships calling on Avalon was 7
- 2016, 2018 and 2022 had the highest number of ships calling @ 10
- 2020 and 2021 had 0 ships call on us
- August typically has 9 ships call on us
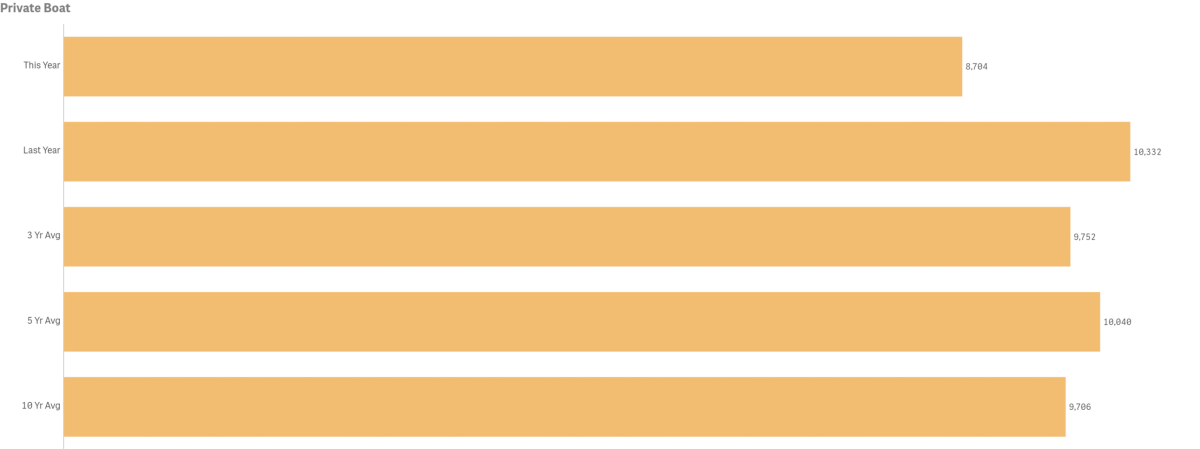
Private Boater Passenger counts totaled 8,704, down from last year by 15.8% or 1,628 visitors
- 2019 had the highest passenger volume for the month @ 10,612
- 2015 had the lowest passenger volume month @ 8,424
- August Private Boater Passenger counts were below the three, five and ten-year averages by 10.7%, 13.3% and 10.3% respectively
- Private Boaters Made up 7.11% of total monthly arrivals
- August’s number of Vessels Anchored was up by 97.5% @ 235 vs 119 last year
- 2017 had the highest number of Vessels Anchored @ 259
- 2012 had the lowest number of Vessels Anchored @ 110
- August was above the three, five and ten-year averages by 48.1%, 64.6% and 45.1% respectively
- August’s number of Vessels on Moorings was down 15.8% from last year @ 2,176 vs. 2,583
- 2019 had the highest number of Vessels on Moorings @ 2,653
- 2012 had the lowest number of Vessels on Moorings @ 2,156
- August was below the three, five and ten-year averages by 10.7%, 13.3% and 10.3% respectively
Arrivals by Air
Combined in-bound air passenger counts for August totaled 3,500 down 19.1% from 4,329 in 2022. 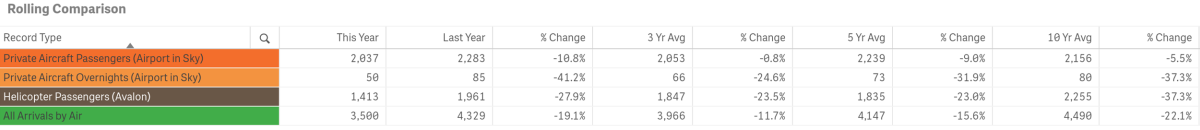
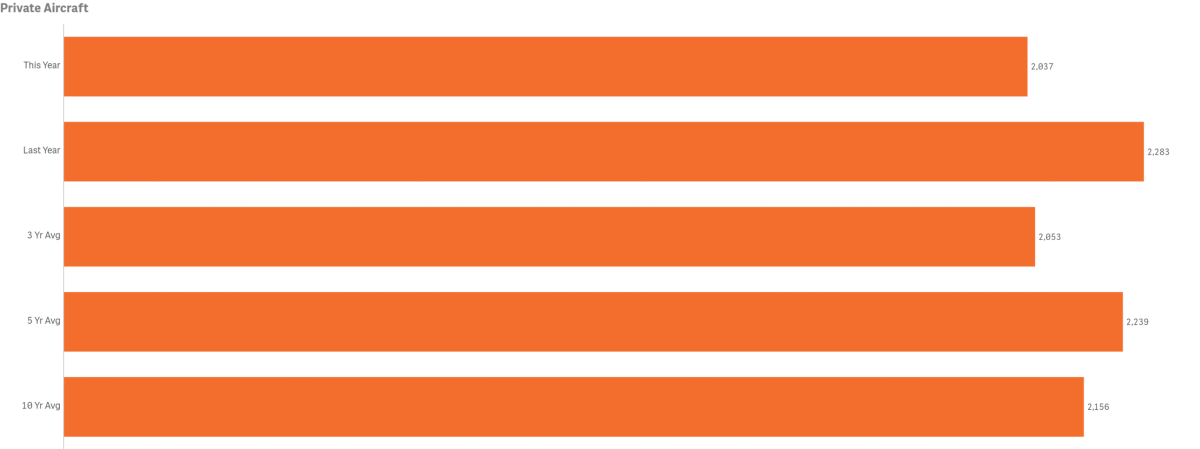
Private Aircraft Passengers (Airport in the Sky) were down 10.8% @ 2,037 vs 2,283 last year
- August’s Private Aircraft Passenger count was below the three, five and ten-year averages by 0.8%, 9.0% and 5.5% respectively
- August’s Private Aircraft Passengers made up 1.66% of total monthly arrivals
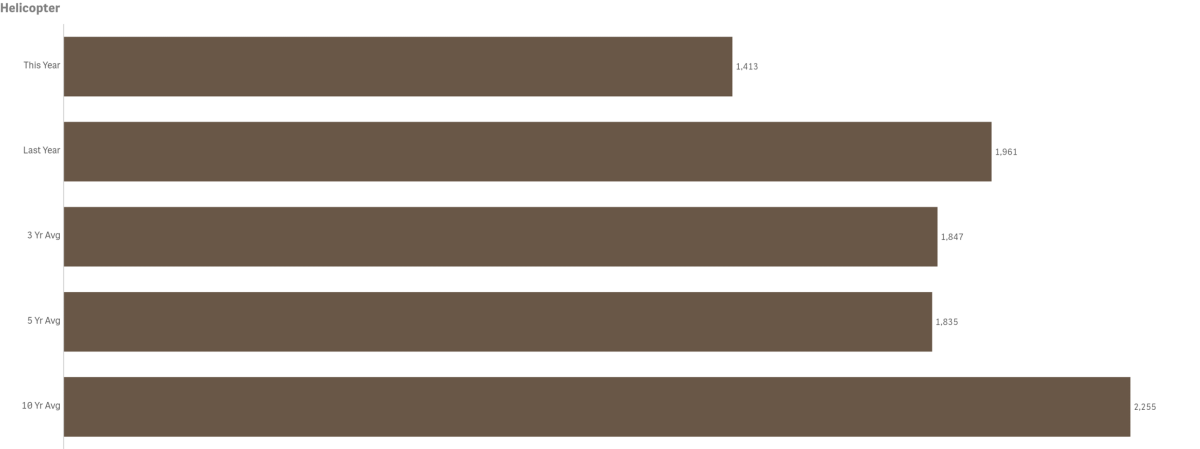
Helicopter Passenger counts were down year-over-year by 27.9% @ 1,413 vs. 1,916
- 2015 had the highest volume for the month @ 2,749
- 2020 the lowest volume for the month @ 1,483
- August Helicopter Passenger counts were below the three, five and ten-year averages by 23.5%, 23.0% and 37.3% respectively
- August Helicopter Passengers made up 1.15% of total monthly arrivals
Lodging
Hotel and Short-Term Rental Occupancy from Smith Travel and AIRDNA

- Hotel Occupancy for August was down by 8.4% @ 75.4% vs. 82.3% in 2022
- Hotel Occupancy was below three, five and ten-year averages by 4.1%, 5.1% and 7.6% respectively
- Short-Term Rental Occupancy for August was down 6.7% @ 70% vs 75% in 2022
- Short-term rental occupancy was below the three-year average by 4.8% but above the five and ten-year averages by 3.4% and 21.1% respectively
- Among our competitive set, Hotels ranked 4th in Occupancy and 3rd in Short-Term Rental Occupancy (high to low)
Competing Destination Occupancies

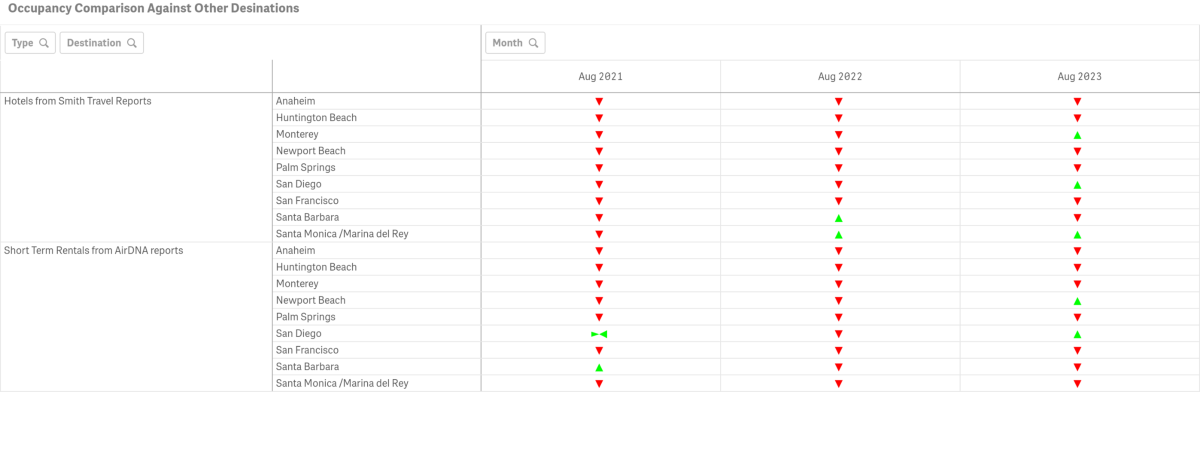
- August Hotel Occupancy was higher than Catalina’s in Monterey, San Diego and Santa Monica, with all other destinations being lower
- August Short-Term Rental Occupancy was higher than Catalina’s in all but Newport Beach and San Diego
Hotel and Short-Term Rental Average Daily Rate from Smith Travel and AIRDNA

- Among our competitive set, Catalina ranked 6th in Average Daily Rate for Hotels and 2nd for STRs (high to low)
- August Hotel Average Daily Rate was up 2.2% @ $286.25 vs. $280.06 in 2022
- August Short-Term Rental Average Daily Rate was up by 4.7% @ $603.00 vs. $576.00 in 2022
Hotel and Short-Term Rental Revenue Per Available Room from Smith Travel and AIRDNA

- Among our competitive set, Catalina ranked 6th for hotels and 2nd for STRs in Revenue Per Available Room (high to low)
- August Hotel Revenue Per Available Room was down 0.9% @ $215.88 vs. $217.92 in 2022
- August Short-Term Rental Revenue Per Available Room was $425.00, down 1.4% from $431.00 in 2022
Visitors Services
Catalina Island Visitor Center

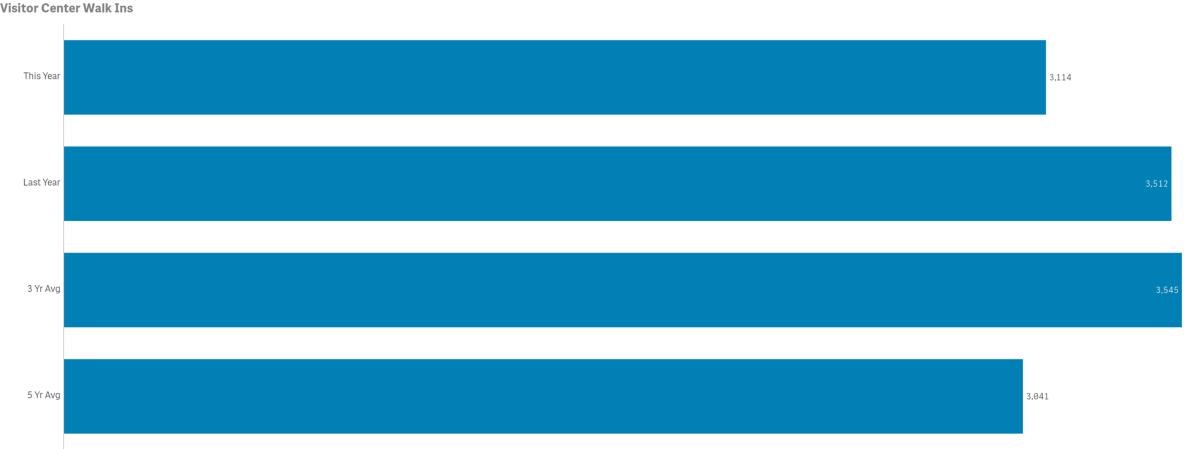
- Walk-ins for the month were down year-over-year by 11.3% @ 3,114 vs. 3,512 in 2022
- 2016 has the highest volume for the month @ 6,431
- 2020 had the lowest volume for the month @ 578
- August walk-in counts were below the three-year average by 12.2% but above the five-year average by 2.4%
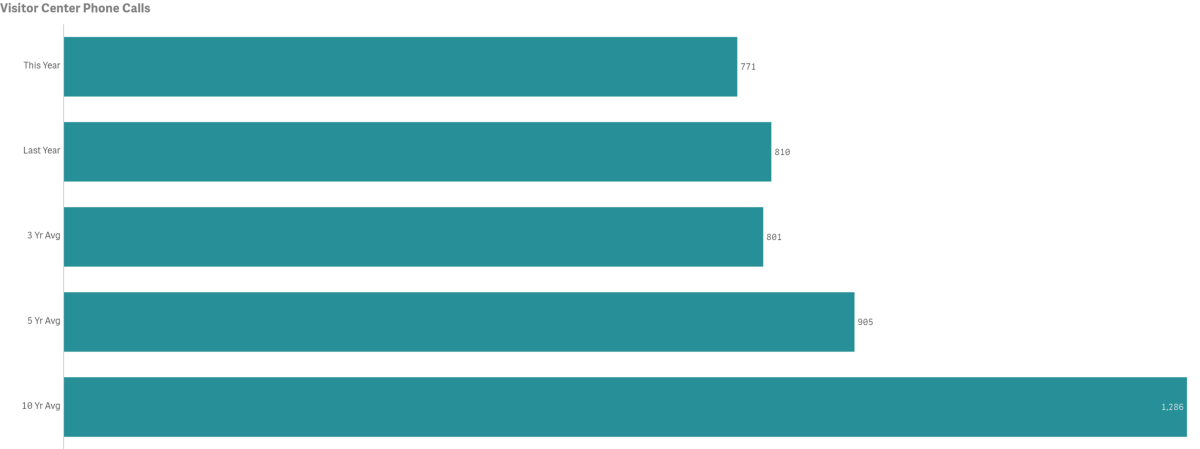
- The number of Phone Calls for the month was down by 4.8% year-over-year @ 771 vs 810
- 2008 had the highest volume of calls for the month @ 2,942
- 2023 had the lowest volume of calls for the month @ 771
- August calls were below the three, five and ten-year averages by 3.7%, 14.8% and 40% respectively
LoveCatalina.com
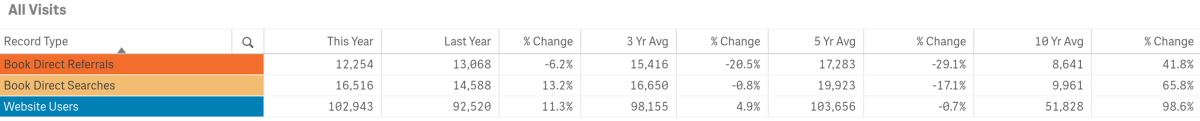
- August LoveCatalina.com total website traffic was up year-over-year by 11.3% @ 102,943 vs 92,520 in 2022
- August total website users were above the three and ten-year averages by 4.9% and 98.6% but below the five-year average by 0.7%
- Book Direct referrals were down year-over-year by 6.2% @ 12,254 vs. 13,068 in 2022
- Book Direct lodging searches were up 13.2% @ 16,516 vs.14,588 in 2022
Note changes to Book Direct in 2021 resulted in shifting traffic between referrals and searches
Visitor Guides & Newsletters
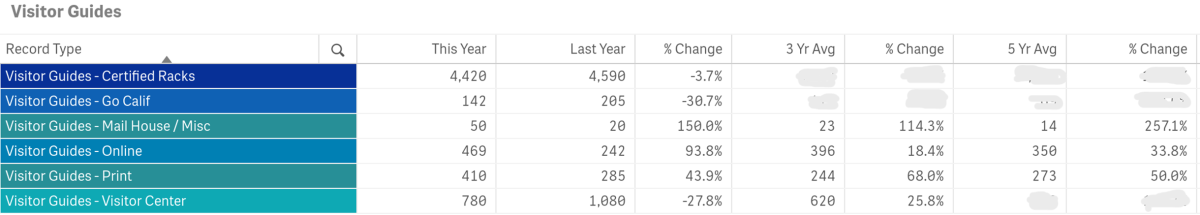
Note measures now include additional source tracking for months and years in which distributions were made:
- 4,420 Guides were delivered to Certified Racks during the month
- Go California Print Guide orders totaled 142, down from 205 in 2022
- Mail House guide deliveries totaled 50, up from 20 in 2022
- Online Guide downloads were up @ 469 vs. 242 in 2022
- Printed Visitor Guide orders on LoveCatalina.com @ 410, were up from 285 last year
- 780 were delivered to the Visitor Center
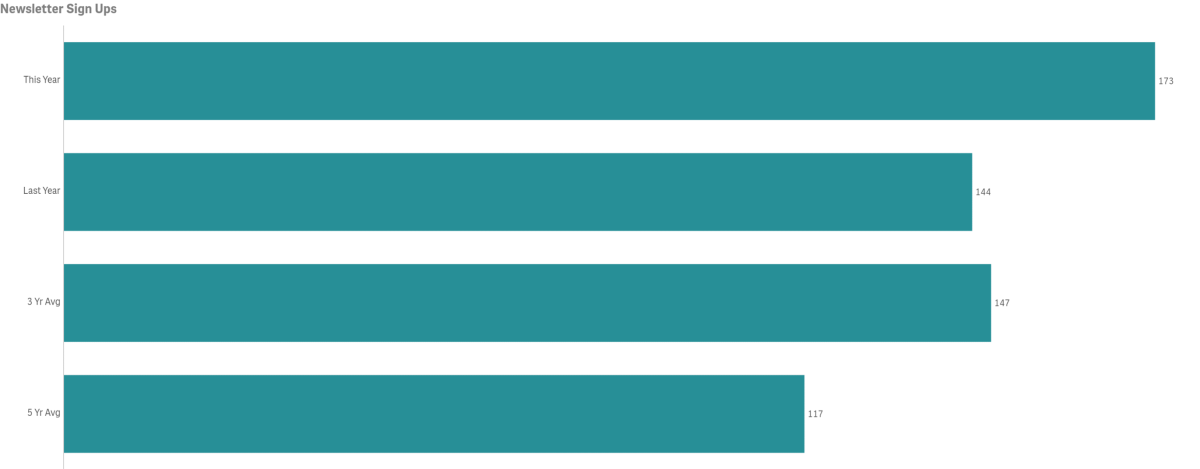
- New E-newsletter subscribers in August were up year-over-year @ 173 vs 144 in 2022
- New subscribers for the month were above the three and five-year averages of 147 and 117
Social Media
Cumulative totals by platform as of August below
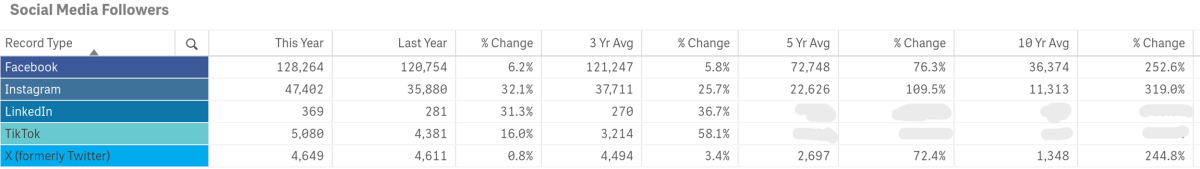
- Facebook followers are up year-over-year by 6.2%
- Instagram followers are up year-over-year by 32.1%
- X followers are up year-over-year by 0.8%
- LinkedIn followers are up year-over-year by 31.3%
- TikTok is up year-over-year by 16.0%.
Year-to-date—Historical Arrivals
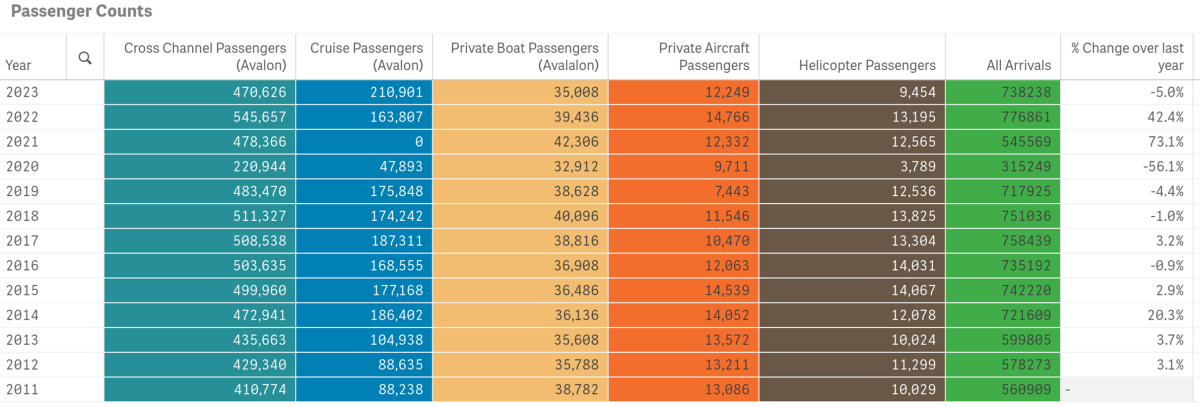
COVID-19 and pre-Covid-19 comparrison data is illustrated in the snapshot above (January – August)
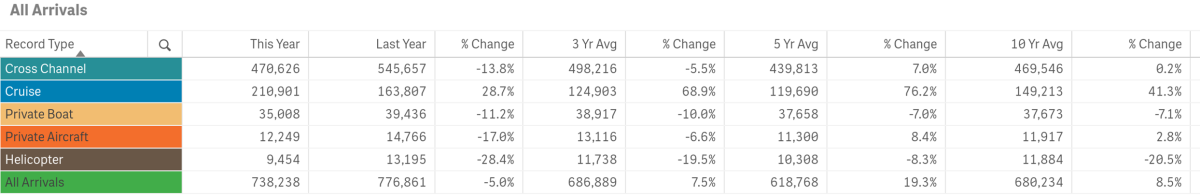
Below is a graph of year-to-date and mutli-year comparissons of all arrivals by sector.
- 2022 had the highest total visitation year-to-date @ 776,861, a difference of 38,623 visitors vs 2023
- 2020 had the lowest year-to-date total visitation @ 315,249
To view historical data for total arrivals by sector, year and month in a spreadsheet form click here.
Year-to-date Lodging
Hotel and Short-Term Rental Occupancy from Smith Travel and AirDNA

- Hotel Occupancy January through August 2023 was 66.9% vs. 70.5% tracked for the same time period in 2022
- Short-Term Rental Occupancy was 59.9%, down from 62.6% in 2022
- According to Smith Travel, Catalina’s average YTD Hotel Occupancy of 66.9% was below the YTD occupancy for all of our competing destinations except for San Francisco and Palm Springs
- According to AirDNA, Catalina’s average Short-Term Rental YTD Occupancy of 59.9% was below all destinations in our competitive set
Year-to-date Visitor Services
Catalina Island Visitor Center

- The number of Phone Calls year-to-date are down by 14.2% @ 4,824 vs. 5,621 in 2022
- Year-to-date Phone Calls were below the three, five and ten-year averages by 9.1%, 14.4% and 36.5% respectively
- Number of Walk-Ins year-to-date are up @ 19,294 vs. 17,339 or 11.3%
- Year-to-date Walk-In counts were above the three and five-year averages by 8.8% and 23.5% respectively
Year-to-date LoveCatalina.com
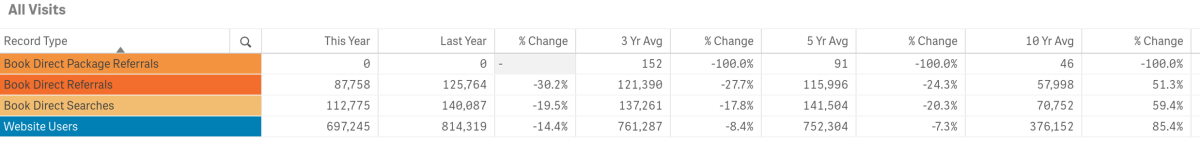
- LoveCatalina.com website users were down year-to-date by 14.4% @ 697,245 vs.814,319 in 2022
- Book Direct lodging searches were down by 19.5% @ 87,758 vs. 125,764 in 2022
- Book Direct referrals were down by 30.2% @ 87,758 vs. 125,764 in 2022
- Book Direct Package referrals were not active on our site
Note changes to Book Direct on member links has resulted in shifting some traffic to referrals vs. searches
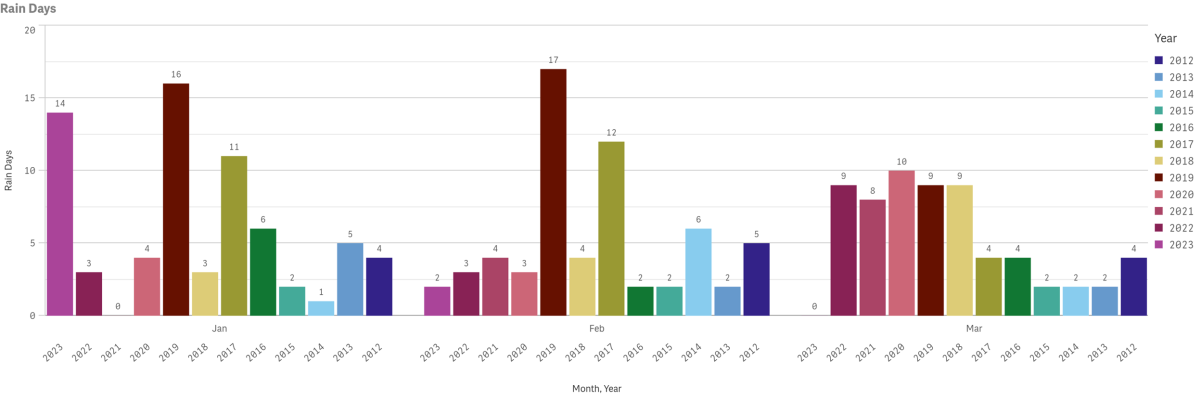
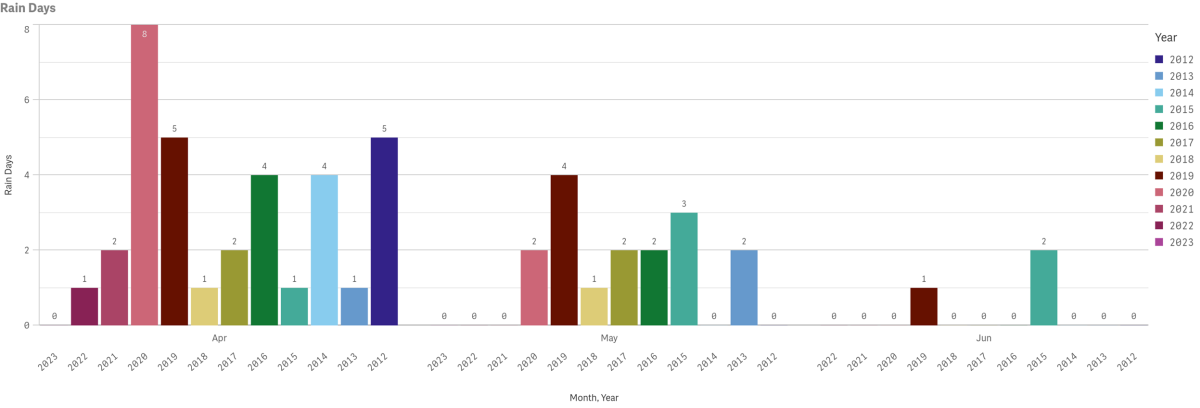
Weather
Data for recent highs, lows and precipitation are not currently available due to broken feed from the Harbor weather station. Multi-year rain days data is also displayed by year and month since 2012, likewise excluding recent months of this year. Measures are taken at Avalon Harbor.


51st Annual New Year’s Eve Gala Celebration
Reservations are On Sale!
A sparkling night of evening gowns, tuxedos, champagne, dining and dancing on Tuesday, December 31 in the world-famous Casino Ballroom.


