Visitor Statistics
Catalina Island welcomes over 1 million visitors a year via ferries, helicopter or private boats and planes. Tracking based on arrivals in Avalon are tracked below. Visitor driven revenues including taxes on hotel and vacation rental stays (TOT), attractions and sales tax are tracked and reported as well by the City of Avalon and also available for download. Reports are updated about once a month.
- Avalon Visitor Driven Revenues - April 2016 - April 2025
- City of Avalon Sales Tax Update - Q3 2024 (July - September)
- Avalon Passenger Counts by Month, Year and Type 2009-2025 (through April 2025)
- Monthly Visitor Counts
The Catalina Island Chamber of Commerce & Visitors Bureau (d.b.a. Love Catalina Island) engaged the firm of Lauren Schlau Consulting to create a profile study of visitors to Catalina Island. The study was conducted in phases, and included samples of visitors arriving by passenger ferries, cruise ships, private boats, helicopters and aircraft. The study segments data for seasonality, weekdays vs. weekends, event attendees and mode of transportation. Economic impacts are included.
- Visitor Profile Study Phase One Results
- Visitor Profile Study Phase Two Results
- Visitor Profile Study Phase Three Results
- Visitor Profile Study: Final Report
- Visitor Profile Study: Summary Report
The Catalina Island Chamber of Commerce & Visitors Bureau (d.b.a. Love Catalina Island) engaged the firm of SMG to conduct a capacity vs. needs study for Catalina Island. The study was conducted in phases, and includes analysis of island visitor data, stakeholder interviews, analysis of infrastructural systems and their respective capacities/limitations as well as peak/off-peak demand periods of visitation. In an effort to stave off situations of over-tourism, the study includes recommendations for driving more visitors to the island in periods of low demand on infrastructure and makes recommendations for reducing demand in peak travel periods.
- Tourism Supply and Demand Analysis and Strategy: Final Report
- 2017 Catalina Island Strategic Marketing Plan
Member Capacity Study
Explore the Island
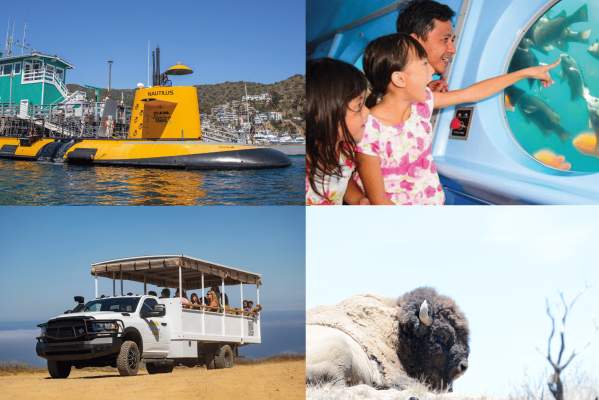
Submarine & Inside Land Tours
Catalina Adventure Tours
Book Direct & Save! Tours offered multiple times daily, Submarine tours depart from Green Pier & Inside Land Tours from the Mole.
$10 Off Catalina Island Ferry
Onboard Catalina Flyer
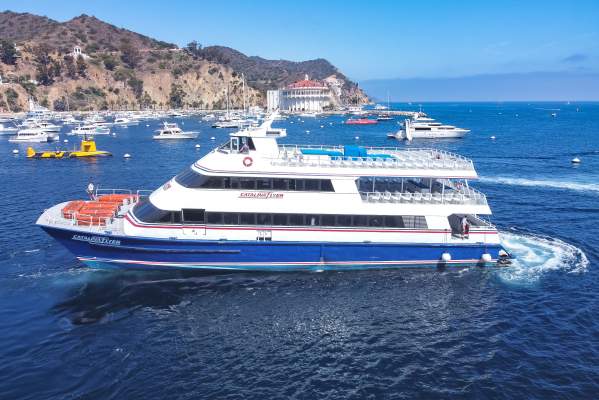
Hop onboard the Catalina Flyer for daily ferry service from Newport Beach to Avalon, Catalina Island in just over 1 hour.
