
April 2025
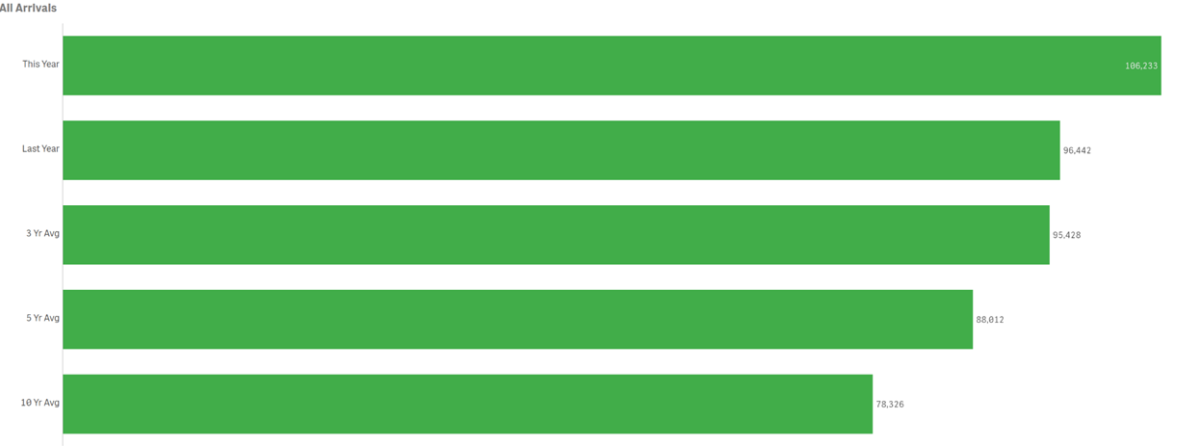
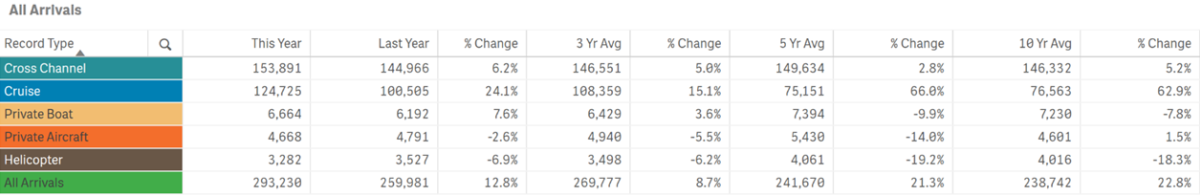
All Arrivals
April visitation increased year-over-year by 10.2% with 106,233 total arrivals
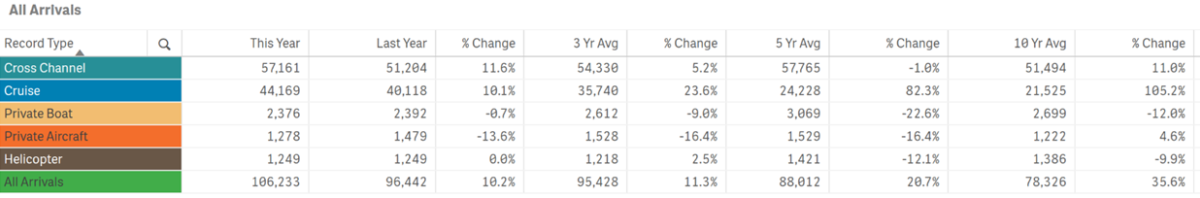
April’s total arrival count was above the three, five and ten-year averages by 11.3%, 20.7% and 35.6% respectively. Cross Channel Counts above include 1,942 arrivals at Two Harbors this year and 2,061 last year.
Previous tracking (below) for the month of April offers comparisons year-over-year by segments.
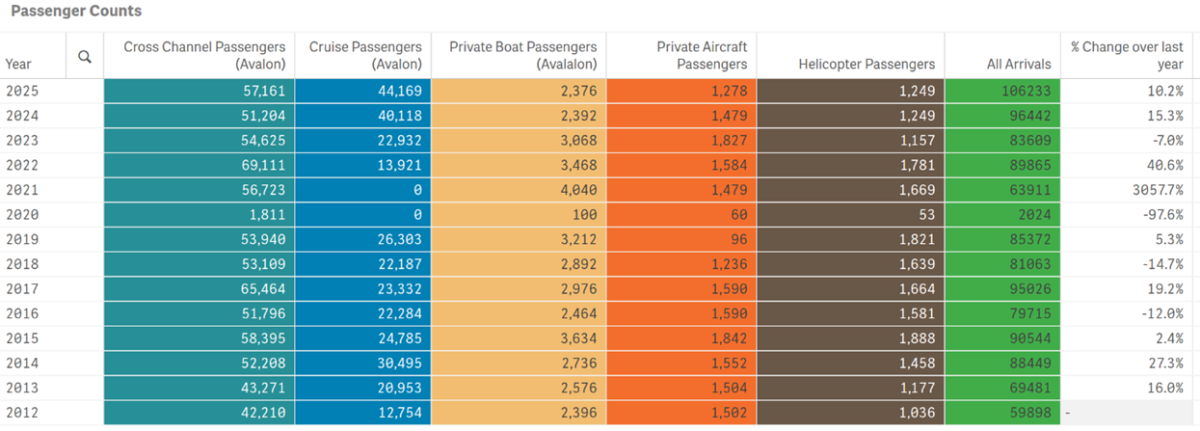
- April 2025 had the highest number of total visitors @ 106,233
- April 2020 had the lowest number of total visitors @ 2,024
Arrivals by Sea
Passengers arriving by sea in April totaled 103,706, up for the month by 10.7% from last year.
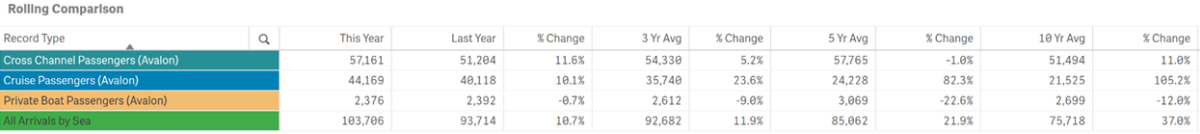
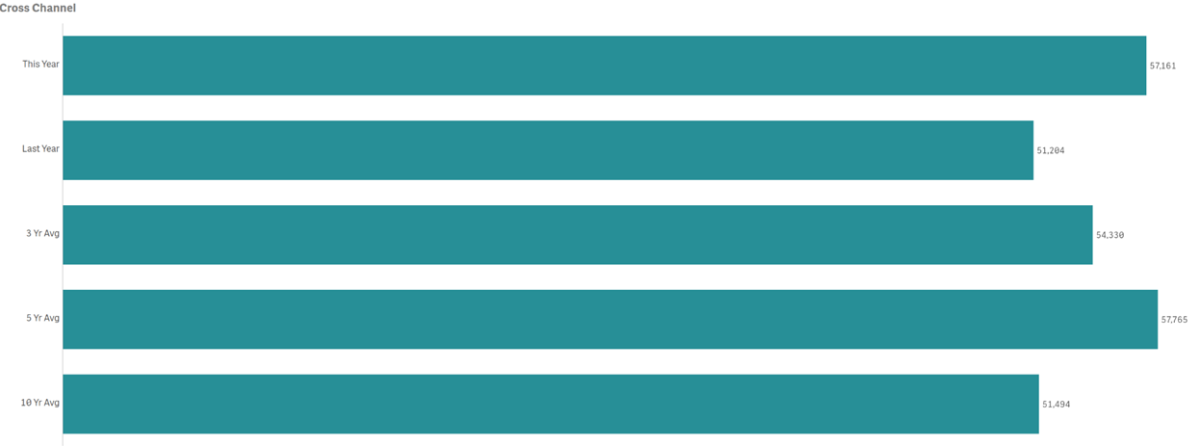
Cross Channel Passenger counts were up 11.6%, an increase of 5,957 people. Cross Channel Counts above include arrivals at Two Harbors.
- 2022 had the highest volume for the month @ 69,111 passengers
- 2020 had the lowest volume for the month @ 1,811 passengers
- April Cross Channel Passenger counts were above the three and ten-year averages by 5.2% and 11.0% respectively but below the five-year average by 1.0%
- Cross Channel Passengers made up 53.81% of total monthly arrivals
Cruise passenger counts totaled 44,169 up from 40,118 last year, an increase of 10.1% from 2024 or 4,051 visitors
- 2024 had the highest Cruise Passenger volume for the month @ 44,169
- 1995 had the lowest Cruise Passenger volume for the month @ 6,497
- April Cruise Passenger counts were above the three, five and ten-year averages by 23.6%, 82.3% and 105.2% respectively
- Cruise Passengers made up 40.4% of total monthly arrivals
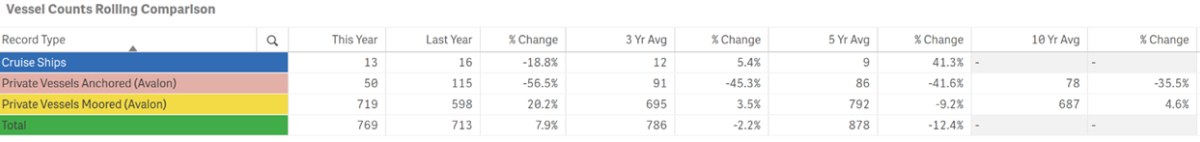
- The number of Cruise Ships calling on Avalon in April was 13
- 2024 had the highest number of ships calling @ 16
- 2021 had 0 ships calling
April typically has 8 ships call
- The Vessel Counts chart above is missing ten-year averages on the number of ships due to a period of time where data was only tracked annually

Private Boater Passenger counts totaled 2,376 down by 0.7% from last year’s total of 2,392
- 2021 had the highest passenger volume for the month @ 4,040
- 2020 had the lowest passenger volume month @ 100
- April Private Boater Passenger counts were below the three, five and ten-year averages by 9.0%, 22.6% and 12% respectively
- Private Boaters made up 2.18% of total monthly arrivals
- April’s number of Vessels Anchored was down 68.8% @ 34 from 109 last year
- 2024 had the highest number of Vessels Anchored for the month @ 115
- 2013 had the lowest number of Vessels Anchored @ 3
- April was below the three, five and ten-year averages by 45.3%, 41.6% and 35.5% respectively
- April's number of Vessels on Moorings was 414, down 1.7% from last year’s 421 or by 7 boats
- 2021 had the highest number of Vessels on Moorings @ 1,010
- 2020 had the lowest number of Vessels on Moorings @ 25
- April was above the three and ten-year averages by 3.5% and 4.6% respectively but below the five-year average by 9.2% and 16.1% respectively
Arrivals by Air
Combined in-bound air passenger counts for April totaled 2,560 down 7.1% from 2,756 in 2024
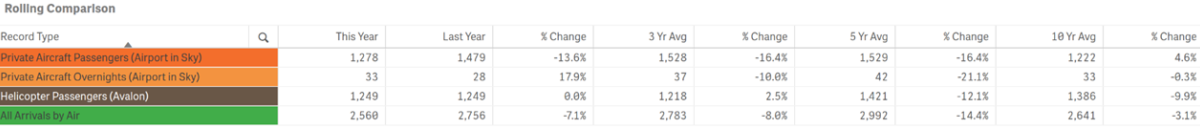
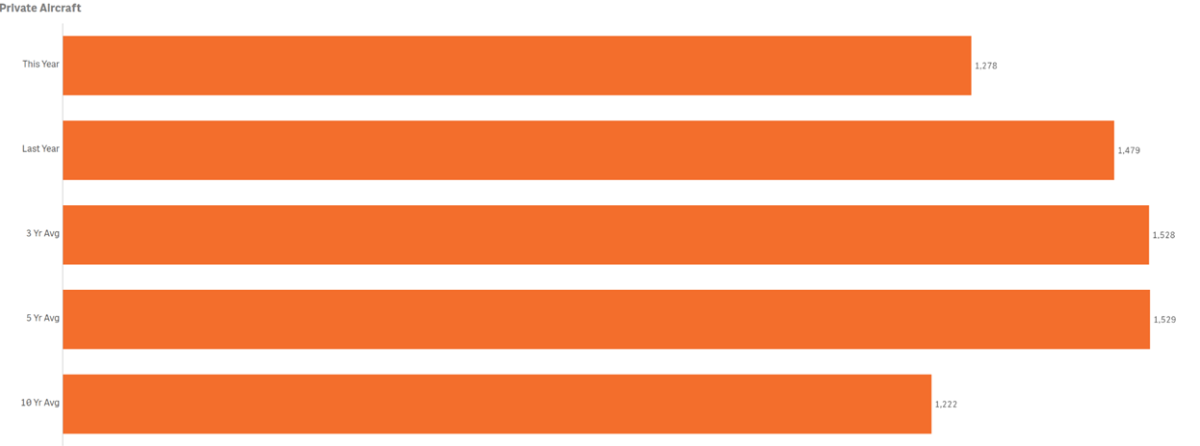
Private Aircraft Passengers (Airport in the Sky) totaled 1,278, down 13.6% vs. last year @ 1,479
- 2015 had the highest volume for the month @ 1,842
- 2020 had the lowest volume for the month @ 60
- April’s Private Aircraft Passenger count was below the three, five and ten-year averages by 16.4%, 16.4% and 4.6% respectively
- Private Aircraft Passengers made up 1.17% of total monthly arrivals
Helicopter Passenger counts totaled 1,249, even year-over-year 2024
- 2015 had the highest volume for the month @ 1,888
- 2020 had the lowest volume for the month @ 53
- Helicopter Passenger counts were above the three-year average by 2.5% but below the five and ten-year averages by 12.1% and 0.3% respectively
- Helicopter Passengers made up 1.14% of total monthly arrivals
Lodging
From Smith Travel, AIRDNA and Visit California
Hotels and Short-Term Rentals Occupancy

- Hotel Occupancy in April was up 22.2% @ 73.8% vs. 60.4% in 2024, according to Smith Travel.
- Hotel Occupancy was above the three and five-year averages by 10.5% and 9.8% respectively. Ten year data is not currently available.
- 2019 had the highest Hotel Occupancy for the month @ 83.5%
- 2020 had the lowest Hotel Occupancy for the month @ 9.4%
- Statewide Hotel Occupancy for the month was 68%, up 2.4% from April 2024
- Nationwide Hotel Occupancy was 64%, up 1.9% from last year
- Short-Term Rental Occupancy for April was up by 17.5% @ 47.0% vs. 40.0% in 2024
- Short-term Rental Occupancy was below the three and five-year averages by 2.1% and 9.1% respectively, but above the ten-year average by 3.0%
- 2015 had the highest Short-term Rental Occupancy for the month @ 88.9%
- 2016 had the lowest Short-term Rental Occupancy for the month @ 30%
- Statewide Short-term Rental Occupancy was 55%
- Nationwide STR Occupancy was 53%
- Among our competitive set, Hotels ranked 4th and Short-Term Rentals ranked last or 10th place in Occupancy (high to low)
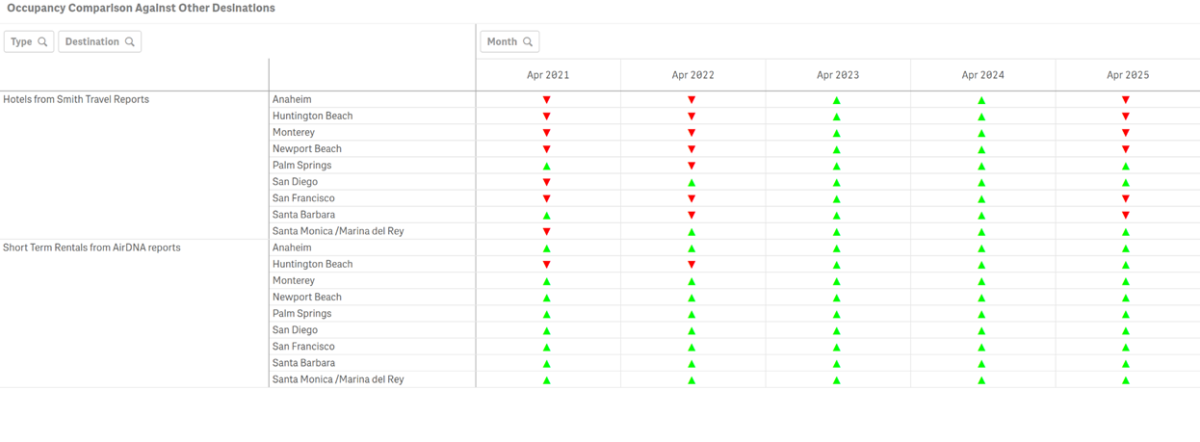
Competing Destination Occupancies

- Hotel Occupancy was higher than Catalina’s in all competing markets
- Short-Term Rental Occupancy was higher than Catalina’s in all competing markets
 Hotel and Short-Term Rental Average Daily Rate
- Hotel Average Daily Rate was up 11.2% @ $218.85 vs. $196.87 in 2024
- Short-Term Rental Average Daily Rate was up by 14.1% @ $730.00 vs. $640.00 in 2024
- Among our competitive set, Catalina ranked 8th in Average Daily Rate for Hotels and 1st for STRs (high to low)
- Statewide Hotel and STR Average Daily Rate was $191.00 and $422.00 respectively
- Nationwide Hotel and STR Average Daily Rate was $161 and $316 respectively
Hotel and Short-Term Rental Revenue Per Available Room
- Hotel Revenue Per Available Room was up 48.1% @ $161.61 vs. $109.13 in 2024
- Short-Term Rental Revenue Per Available Room was up 20.1% @ $340.00 vs. $283.00 in 2024
- Among our competitive set, Catalina ranked 7th for hotels and 1st for STRs in Revenue Per Available Room (high to low)
- Statewide Hotel and STR Revenue Per Available Room was $131.00 and $233.00 respectively
- Nationwide Hotel and STR Revenue Per Available Room was $103.00 and $168.00 respectively
Visitors Services
Catalina Island Visitor Center
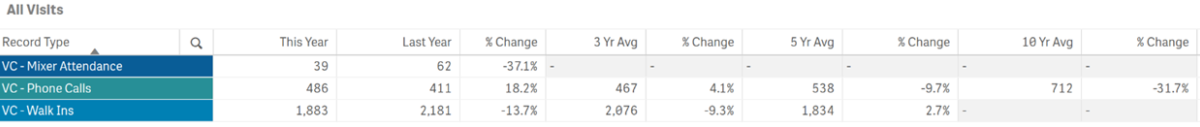
- April Mixer attendance was down year-over year at 39 vs 62 or a decrease of 37.1%
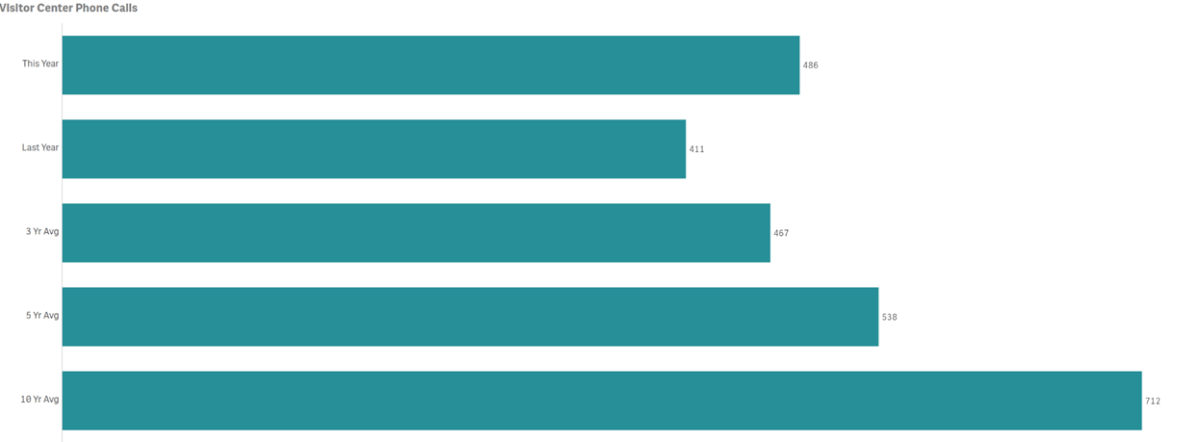
- Phone Calls for the month were up year-over-year by 18.2% @ 486 vs. 41 in 2024 and up from the three-year average by 4.1% but down for the five and ten-year averages by 9.7% and 31.7% respectively
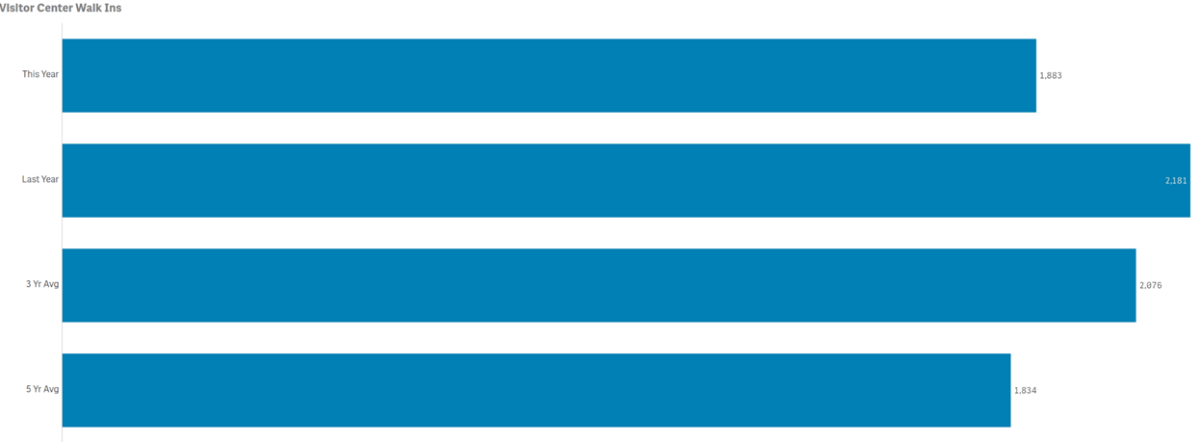
- Walk-ins for the month were down year-over-year by 13.7% @ 1,883 vs. 2,181 in 2024. Walk-ins are below the three-year average by 9.3% but above the five-year average by 2.7%
- 2007 had the highest volume for the month @ 1,693
- 2020 had the lowest volume for the month @ 217
Increased use of online and mobile self-help tools for reservations and research are being seen as the main reasons for periods with declining calls
LoveCatalina.com
Google Business Stats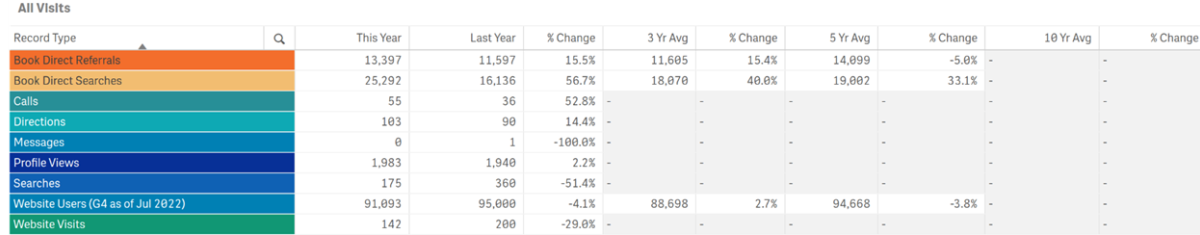
- April LoveCatalina.com total website traffic was down 4.1% year-over-year @ 91,093 vs. 95,000 in 2024
- April total website users were above the three-year average by 2.7% but below the five-year average by 3.8%
- Book Direct lodging referrals were up year-over-year by 15.5% @ 13,397 vs. 11,597 in 2024
- Book Direct lodging searches were up 56.7% @ 25,292 vs. 16,136 in 2024
- Additional Google metrics are now being tracked for users opting to navigate to calls, directions, searches etc., with one year of data now in hand.
Note changes to Book Direct in 2021 resulted in shifting traffic between referrals and searches. New Google metrics inhibit ten-year reporting in our software.
Visitor Guides & Newsletters
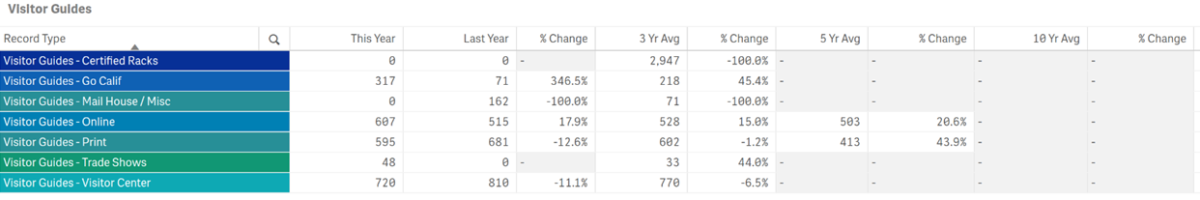
- Certified Racks did not require new deliveries during the month
- Go California Printed Guide orders totaled 317, up from 71 in 2024
- Mail House fulfillment was 0 vs 162 in 2024
- Online Guide downloads were up 17.9% @ 607 vs. 515 in 2024
- Printed Visitor Guide orders on LoveCatalina.com @ 595 were down 12.6% from 681 last year
- Trade Show distribution was 48 this year vs 0 in 2024
- Visitor Guides delivered to the Visitor Center totaled 720, down from 810 last year
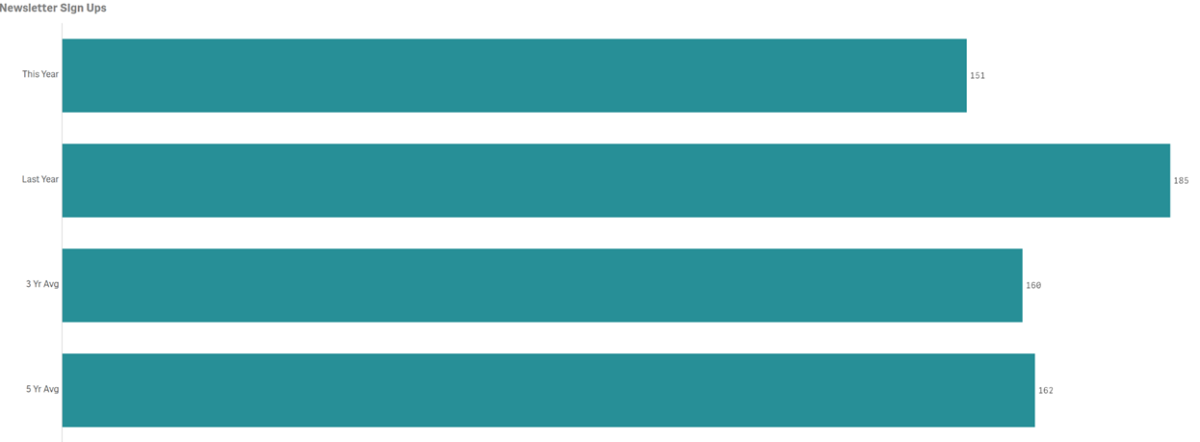
- New E-newsletter subscribers in April were down year-over-year @ 151 vs 186 last year
- New subscribers for the month were below the three and five-year averages
Social Media
Cumulative totals by platform as of April below

- Facebook followers are up year-over-year by 6.2%
- Instagram followers are up year-over-year by 28.6%
- LinkedIn followers are up year-over-year by 22.1%
- Threads followers are up by 60.9%
- TikTok followers are up year-over-year by 14.6%.
- X followers are down year over-year by 3.1%
Trip Origination
Placer.AI
All Placer.AI data below is presented in descending order
- The top five states from which Catalina’s April overnight visitors originated were California @ 83.75%, Nevada @ 2.92%, Arizona @1.92%, Texas @1.51% and Massachusetts @ 1.3%
- The top five cities/DMAs of origination based on number of overnight visitor trips made to the island in April were Los Angeles, San Diego, Riverside/San Bernardino, San Francisco and San Jose (highest to lowest)
- The top five DMAs in nights generated were Los Angeles, San Diego, Riverside, San Jose and San Francisco (highest to lowest)
- The top five most visitors per zip code of origin were 93117 (Santa Barbara), 92529 (Temecula), 92064 (San Diego), 92025 (San Diego) and 91750 (Glendora)
- Top five cities ranked by daily spending potential were San Jose @ $325.30, Boston $300.50, San Francisco @ $293.90, Santa Cruz @ $254.10, and Ventura @ $251.80
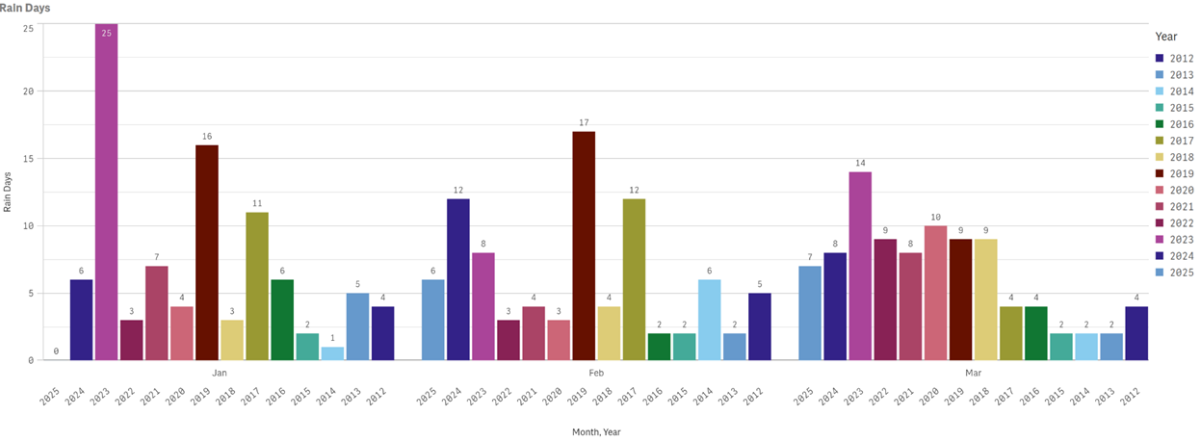
Weather
High, low and rain days for April (multiple years).
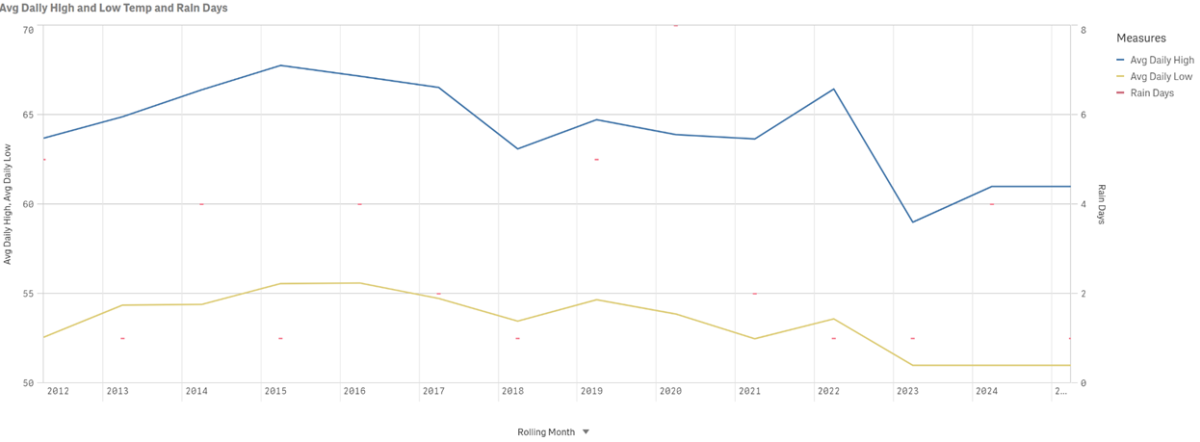
Multi-year counts of rain days for the month of April Measures are taken at Avalon Harbor. 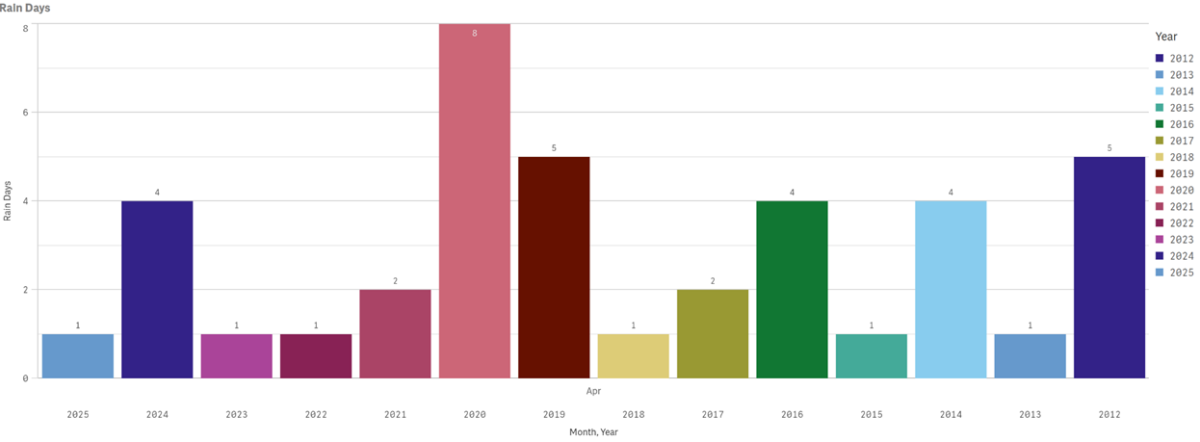
Year-to-date and Historical Arrivals
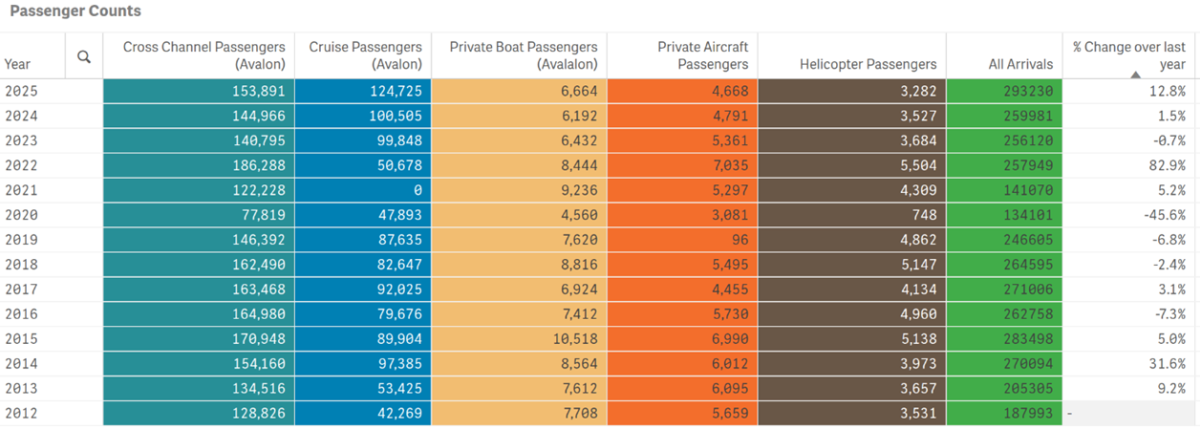
Data above is for January – April of each year.
Below is a graph of year-to-date with mutli-year comparisons of all arrivals by sector
- 2025 year-to-date total visitation is 293,230, up 12.8% from 259,981 last year
- 2025 year-to-date visitation is above the three, five and ten-year average by 8.7%, 21.3% and 22.8% respectively.
To view historical data for total arrivals by sector, year and month in a spreadsheet form click here.
Quarterly
Year-to-date Lodging
Hotel and Short-Term Rental Occupancy from Smith Travel, AirDNA and Visit California

- Hotel Occupancy January through April 2025 is up 10.5% @ 60.7% vs. 54.9% tracked for the same time period in 2024
- Short-Term Rental Occupancy was 34.9%, down 3.7% from 2024 which was 36.3%
- Catalina’s average year-to-date Hotel Occupancy of 60.7% was below the YTD occupancy for all ten competing destinations
- Catalina’s average Short-Term Rental year-to date Occupancy of 34.9% was not reported
- Year-to-date statewide Hotel and STR Occupancy was unavailable at the time of reporting
- National year-to-date Hotel and STR Occupancy was unavailable at the time of reporting
Quarterly
Year-to-date Visitor & Member Services
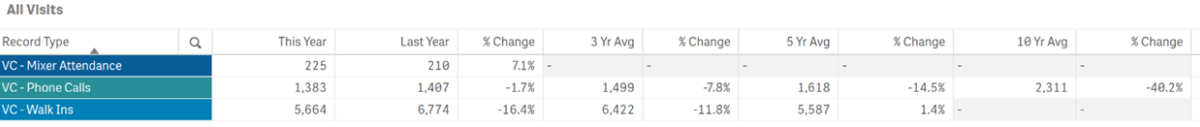
- The number of Mixer attendees year-to-date was up 7.1% @ 225 vs. 210 in 2024
- The number of Phone Calls year-to-date are down by 1.7% @1,383 vs. 1,407 in 2024
- Year-to-date Phone Calls were below the three, five and ten-year averages by 7.8%, 14.5% and 40.2% respectively
- The Number of Walk-Ins year-to-date are down @ 5,664 vs. 6,774 or 16.4%
- Year-to-date Walk-In counts were below the three-year average by 11.8%, but above the five-year average by 1.4%
Year-to-date
LoveCatalina.com
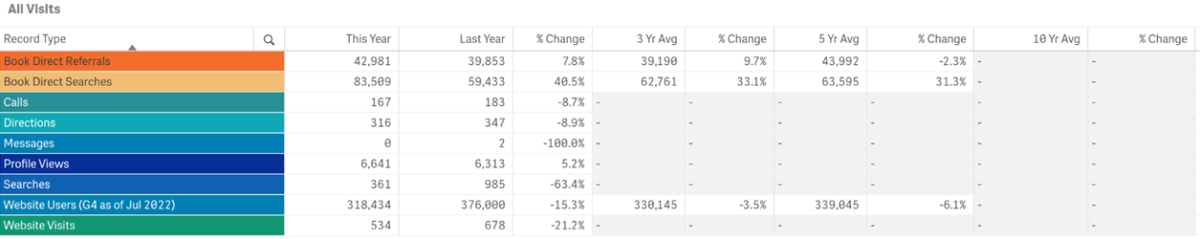
- Book Direct referrals are up by 7.8% year-to-date @ 42,981 vs. 39,853 in 2024
- Book Direct lodging searches were up by 40.5% @ 83,509 vs. 59,433 in 2024
- Calls connecting from LoveCatalina.com were down 8.7% from last year
- Links to directions on LoveCatalina.com were down 8.9% from last year
- Business profile views were up 5.2% from last year
- Searches made on LoveCatalina.com were down 63.4% from last year
- Website Users were down 15.3% from last year
- Visits to other websites from LoveCatalina.com were down 21.2% from last year
-
Note: Google’s implementation of Gemini is seen as impacting traditional website performance, Changes to Book Direct on member links has resulted in shifting some traffic to referrals vs. searches and Google website traffic reporting moved to G4 effective July 2022. Newer measures do not yet have multi-year tracking to report.
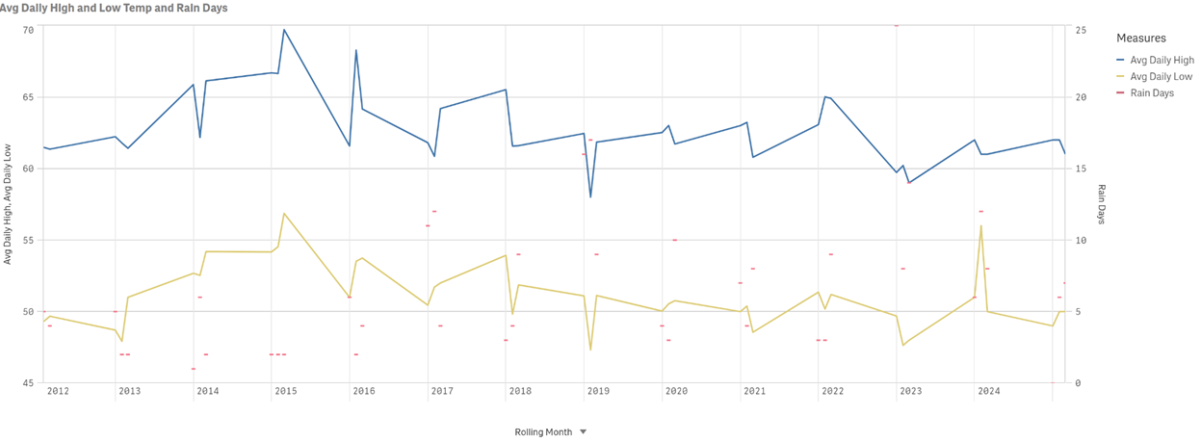
Year-to-date Weather
Multi-year temperature and rain days by month (January-April) are displayed below. Measures are taken at Avalon Harbor.


Submarine & Inside Land Tours
Catalina Adventure Tours
Book Direct & Save! Tours offered multiple times daily, Submarine tours depart from Green Pier & Inside Land Tours from the Mole.

$10 Off Catalina Island Ferry
Onboard Catalina Flyer
Hop onboard the Catalina Flyer for daily ferry service from Newport Beach to Avalon, Catalina Island in just over 1 hour.

