
January 2024
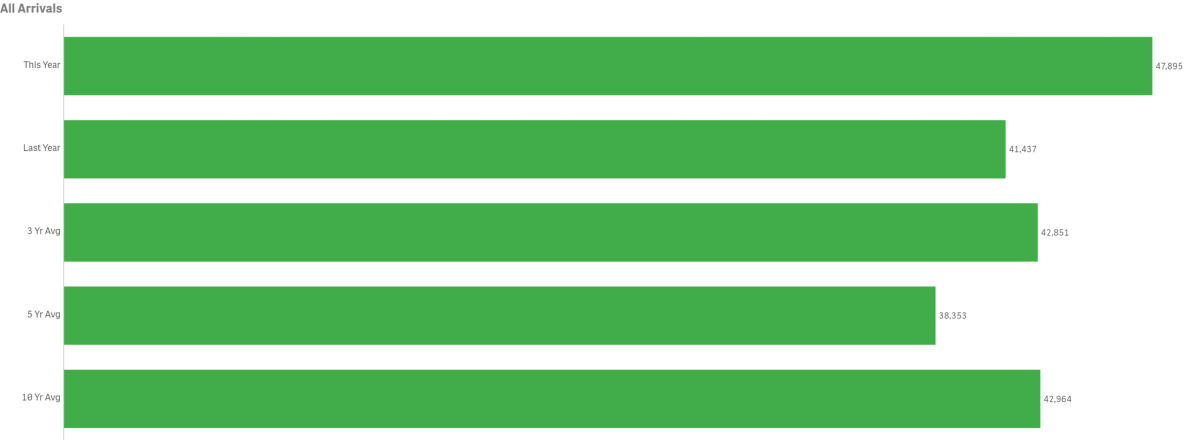
All Arrivals
January visitation increased year-over-year by 15.6% or 6,458 visitors totaling 47,895 arrivals.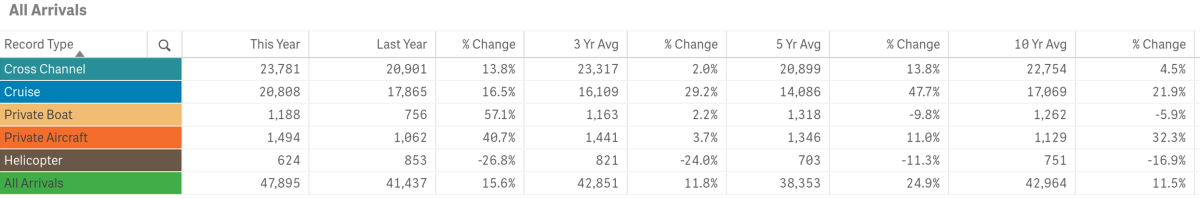
January’s total in-bound passenger count was above the three, five and ten-year averages for the month by 15.6%, 11.8% and 24.9% respectively.
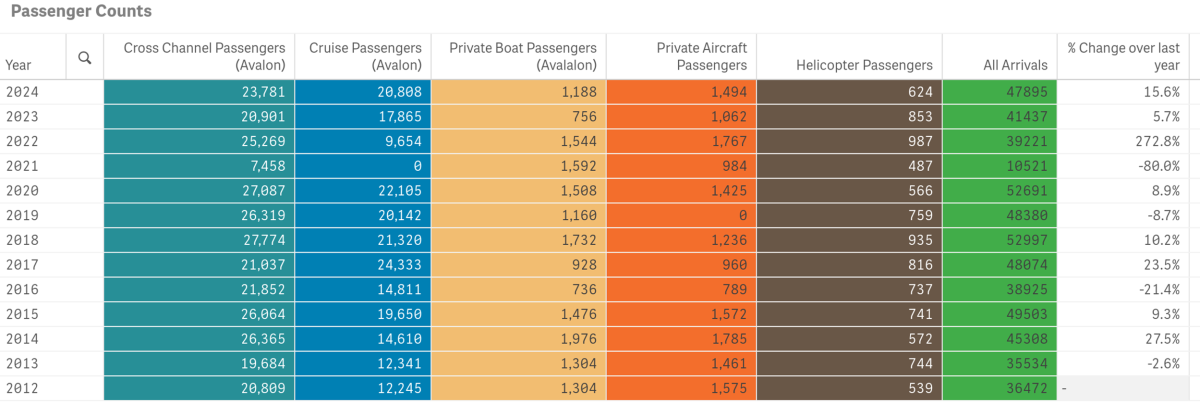
Previous tracking (below) for the month of January offers a comparison with and without COVID-19 impacts
To view historical data for total arrivals by sector, year and month in a spreadsheet form click herePDF File.
Arrivals by Sea
Passengers arriving by sea, totaled 20,808, up for the month by 16.5% from last year.
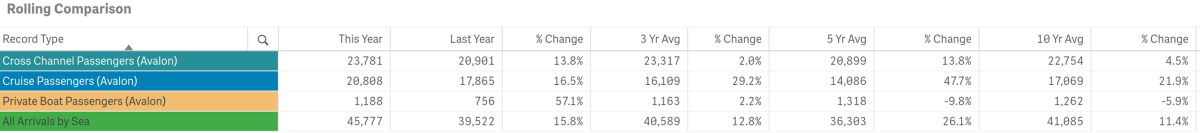
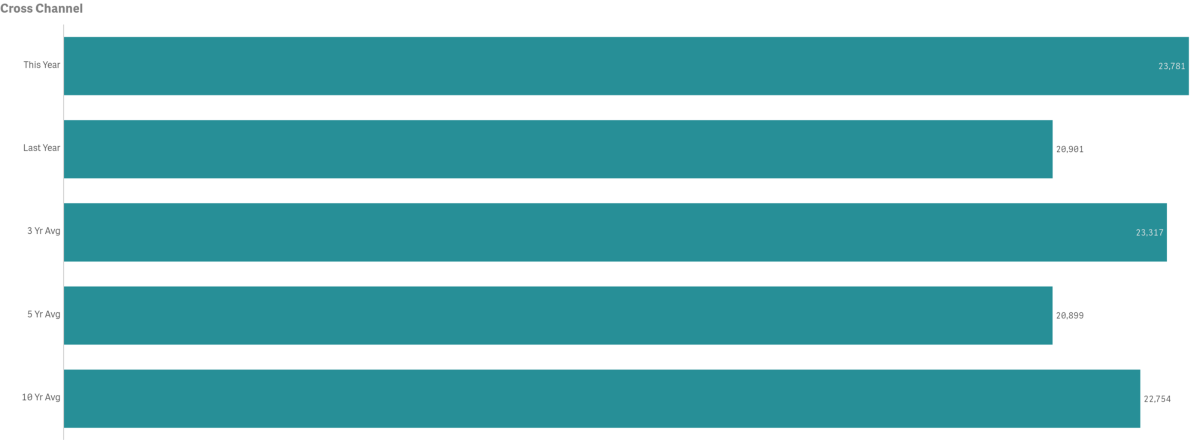
Cross Channel Passenger counts were up 13.8%, an increase of 2,880 people
- 2018 had the highest volume for the month @ 27,774 passengers
- 2008 had the lowest volume for the month @ 15,650 passengers
- January Cross Channel Passenger counts were above the three, five and ten-year averages by 2.0%, 13.8% and 4.5% respectively
- Cross Channel Passengers made up 49.65% of total monthly arrivals
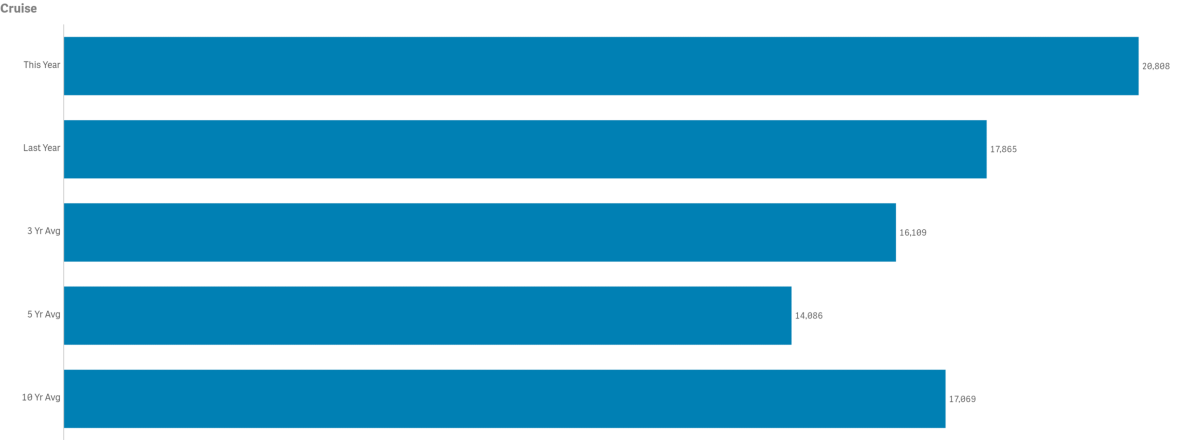
Cruise passenger counts totaled 20,808, up by 16.5% from 2023 or by 2,943 visitors
- 2010 had the highest Cruise Passenger volume for the month @ 24,444
- 2021 had the lowest Cruise Passenger volume for the month @ 0
- January Cruise Passenger counts were above the three, five and ten-year averages by 29.2%, 47.7% and 21.9% respectively.
- Cruise Passengers made up 43.44% of total monthly arrivals
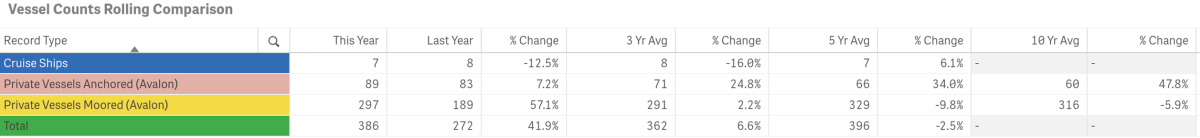
- The number of Cruise Ships calling on Avalon in January was 7
- In 2023, the number of cruise ships visiting was 8
- 2017 had the highest number of ships calling @ 11
- 2021 had 0 ships calling
- January typically has 9 ships call on us
- The Vessel Counts chart above is missing ten-year averages on number of ships due to a period of time where monthly data was not tracked.
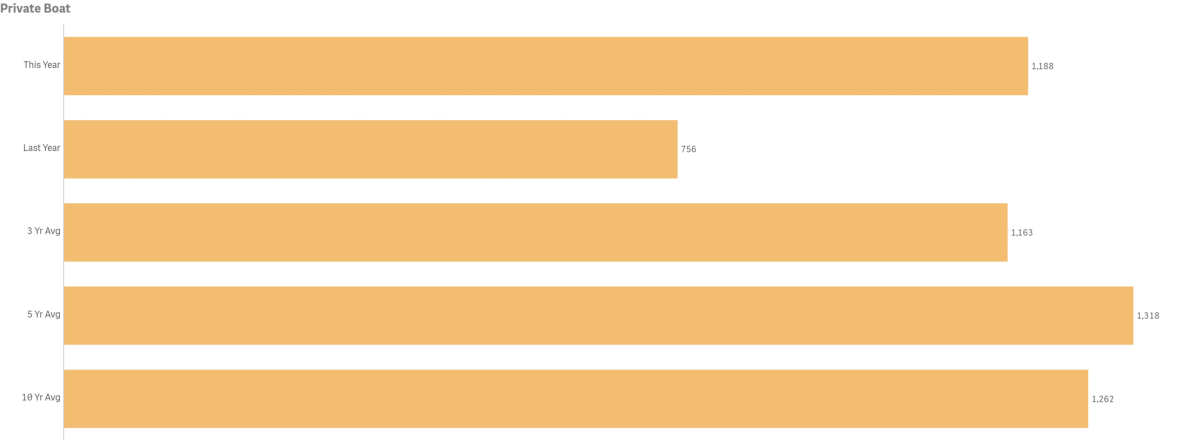
Private Boaters Passenger counts totaled 1,188, up from last year by 57.1% or 432 visitors
- 2014 had the highest passenger volume for the month @ 1,976
- 2016 had the lowest passenger volume month @ 736
- January Private Boater Passenger counts were above the three-year average by 2.2% but below the five and ten-year averages by 9.8% and 5.9% respectively
- Private Boaters Made up 2.48% of total monthly arrivals
- January’s number of Vessels Anchored was up by 7.2% from last year or by 6 boats
- 2019 had the highest number of Vessels Anchored @ 110
- 2012 had the lowest number of Vessels Anchored @ 13
- January was above the three, five and ten-year averages by 24.8%, 34.0% and 47.8% respectively
- January’s number of Vessels on Moorings was up 57.1% from last year or by 108 boats
- 2014 had the highest number of Vessels on Moorings @ 494
- 2016 had the lowest number of Vessels on Moorings @ 184
- January was above the three-year average by 2.2% but below the five and ten-year averages by 9.8% and 5.9% respectively
Arrivals by Air
Combined in-bound air passenger counts for January totaled 2,135, up 10.7% or 206 Arrivals from 2023. 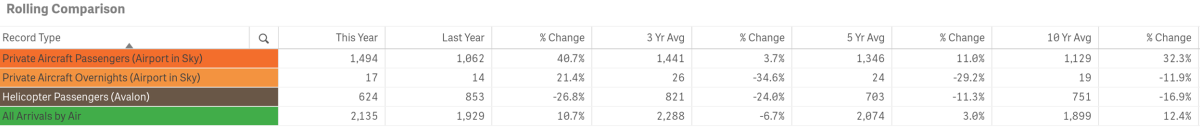
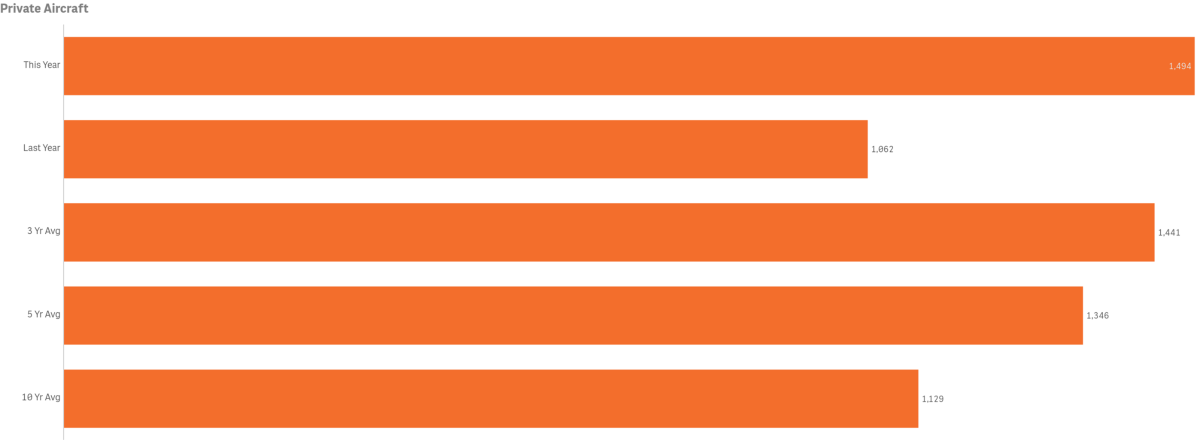
Private Aircraft Passengers (Airport in the Sky) totaled 1,494, up 40.7% or by 432 passengers vs. last year
- 2014 had the highest volume for the month @ 1,785
- 2019 the lowest volume for the month @ 0 (Construction closure)
- January’s Private Aircraft Passenger count was above the three, five and ten-year averages by 3.7%, 11% and 32.3% respectively
- Private Aircraft Passengers made up 3.12% of total monthly arrivals
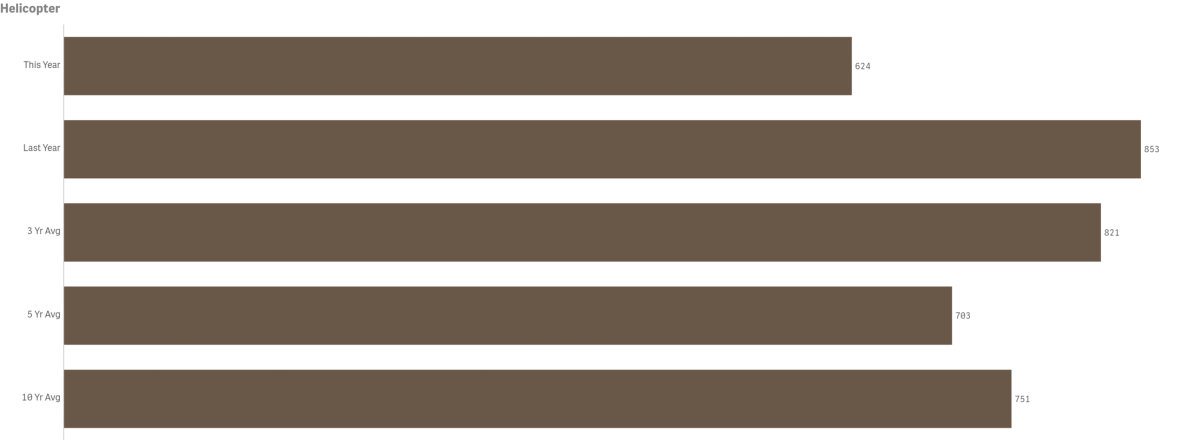
Helicopter Passenger counts totaled 624, down year-over-year by 26.8% or 229 arrivals
- 2022 had the highest volume for the month @ 987
- 2012 the lowest volume for the month @ 539
- January Helicopter Passenger counts were below the three, five and ten-year averages by 24.0%, 11.3% and 16.9% respectively
- Helicopter Passengers made up 1.30% of total monthly arrivals
Lodging
Hotel and Short-Term Rental Occupancy from Smith Travel and AIRDNA

- Hotel Occupancy for January was up by 3.4% @ 51.0% vs. 49.3% in 2023
- Hotel Occupancy was above three and five-year averages by 6.6% and 11.1% respectively but below the ten-year average by 4.2%
- 2018 had the highest Hotel Occupancy for the month @ 68.9%
- 2021 had the lowest Hotel Occupancy for the month @ 23.3%
- Visit California reports statewide Hotel Occupancy for the month @57%, which is down 1% from last year
- Short-Term Rental Occupancy for January was down 15.2% @ 28.0% vs. 33.0% in 2023
- Short-term rental occupancy was below the three, five and ten-year averages by 14.3%, 10.8% and 1.1% respectively
- 2022 had the highest Short-term Rental Occupancy for the month @ 37%
- 2019 had the lowest Short-term Rental Occupancy for the month @ 19.3%
- Visit California did not report statewide Short-term Rental Occupancy for the month
- Among our competitive set, Hotels and Short-Term Rental both rated 10th or last place in Occupancy (high to low)
Competing Destination Occupancies

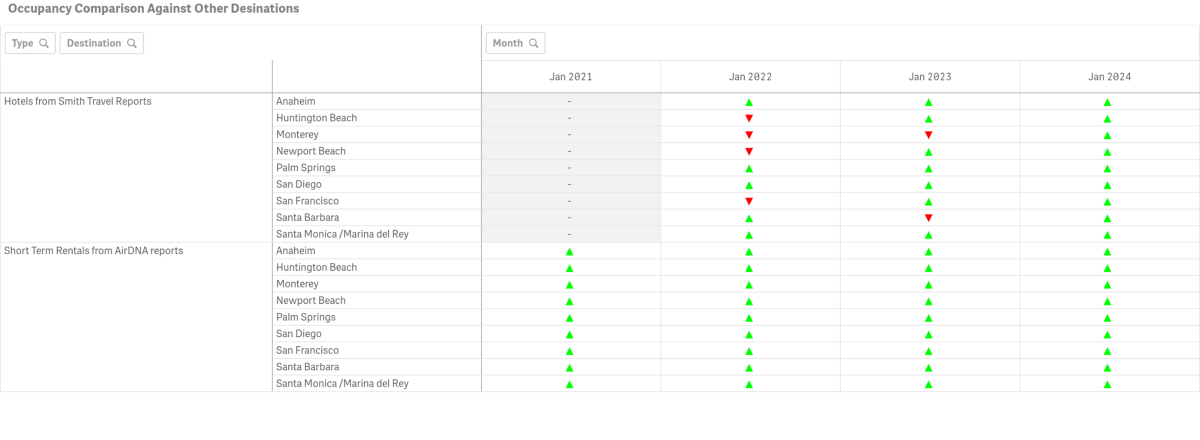
- Hotel Occupancy was higher than Catalina’s in all competing markets
- Hotels in our comp set did not report for January in 2021 due to COVID-19 impacts
- Short-Term Rental Occupancy was higher than Catalina’s in all competing markets
Hotel and Short-Term Rental Average Daily Rate from Smith Travel and AIRDNA

- Hotel Average Daily Rate was up 11.4% @ $202.62 vs. $181.92 in 2023
- Short-Term Rental Average Daily Rate was up by 5.2% @ $484.00 vs. $460.00 in 2023
- Among our competitive set, Catalina ranked 6th in Average Daily Rate for Hotels and 2nd for STRs (high to low)
- Statewide Hotel Average Daily Rate was $183, and increase of 2% over last year
- Statewide STR Average Daily Rate was not reported
Hotel and Short-Term Rental Revenue Per Available Room from Smith Travel and AIRDNA

- Hotel Revenue Per Available Room was up 11.4% @ $202.62 vs. $181.92 in 2023
- Short-Term Rental Revenue Per Available Room was $484.00, up 5.2% from $460.00 in 2023
- Among our competitive set, Catalina ranked 8th for hotels and 3rd for STRs in Revenue Per Available Room (high to low)
- Statewide Hotel Revenue Per Available Room was $104.00, flat with last year
- Statewide Short Term Rental Revenue Per Available Room was not reported
Visitors Services
Catalina Island Visitor Center

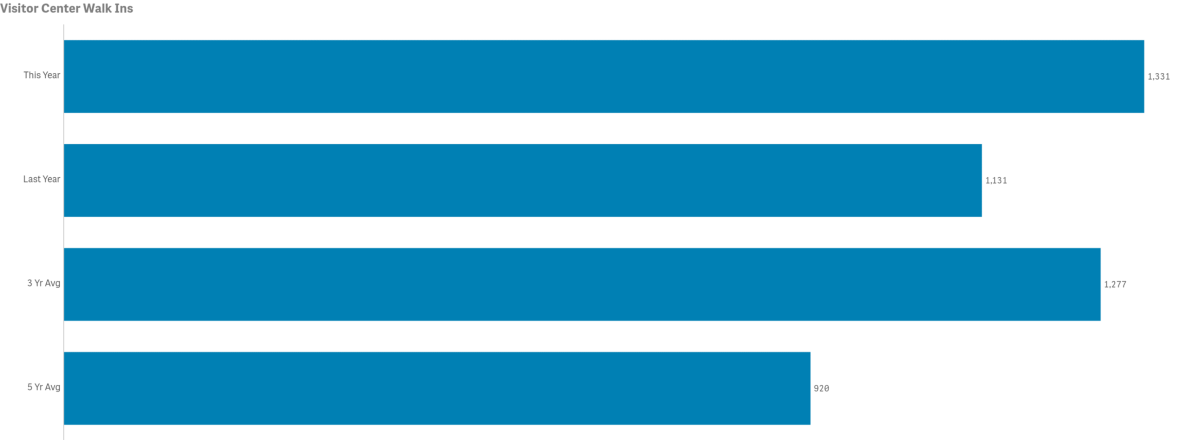
- Walk-ins for the month were up year-over-year by 17.7% @ 1,331 vs. 1,131 in 2023
- 2017 had the highest volume for the month @ 1,703
- 2021 had the lowest volume for the month @ 2
- January walk-in counts were above the three and five-year averages by 4.2% and 44.7% respectively
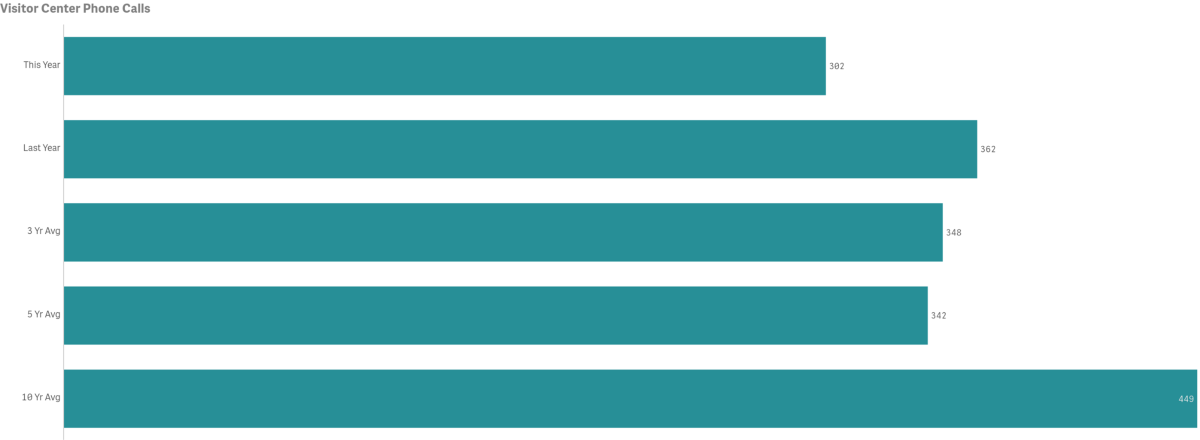
- The number of Phone Calls for the month was down by 16.6% year-over-year @ 302 vs 362
- 2012 had the highest volume of calls for the month @ 1,131
- 2021 had the lowest volume of calls for the month @ 214
- January calls were below the three, five and ten-year averages by 13.3%, 11.8% and 32.8% respectively
- Increased use of online and mobile self-help tools for reservations and research are being seen as the main reason for declining calls. Inquiries on social media and via email are often taking the place of calls as well.
LoveCatalina.com

- LoveCatalina.com total website traffic was up year-over-year by 23.6% @ 89,000 vs 72,000 in 2023
- Total website users were above the three and five-year averages by 7.3% and 17.6% respectively
- Book Direct referrals were up year-over-year by 7.0% @ 8,319 vs 7,775 in 2023
- Book Direct lodging searches were up 26.5% @ 13,704 vs. 10,835 in 2022
Note changes to Book Direct in 2021 resulted in shifting traffic between referrals and searches
Visitor Guides & Newsletters
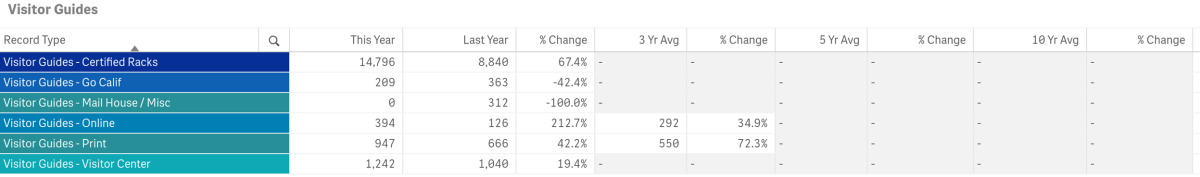
Note measures now include source tracking for months and years in which distributions were made by subset
- Certified racks were filled with 14,796 Guides
- Go California Print Guide orders totaled 209, down from 106 in 2022
- Online Guide downloads were up @ 394 vs.126 in 2023
- Printed Visitor Guide orders on LoveCatalina.com were 947, up from 666 last year
- 1,242 Visitor Guides were delivered to the Visitor Center
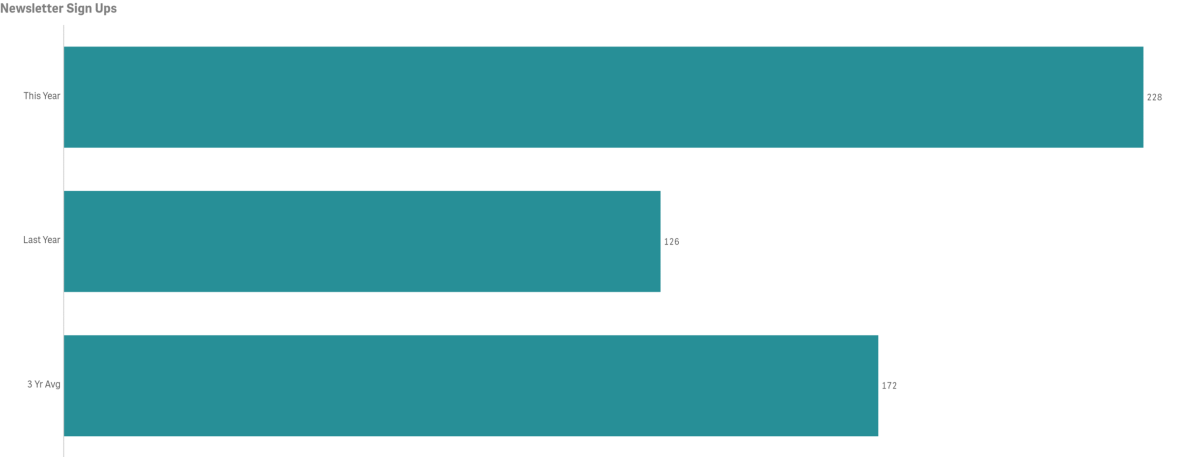
- New E-newsletter subscribers in January were up year-over-year @ 228 vs 126 in 2023
- New subscribers for the month were above the three-year average
Social Media
Cumulative totals by platform as of January below
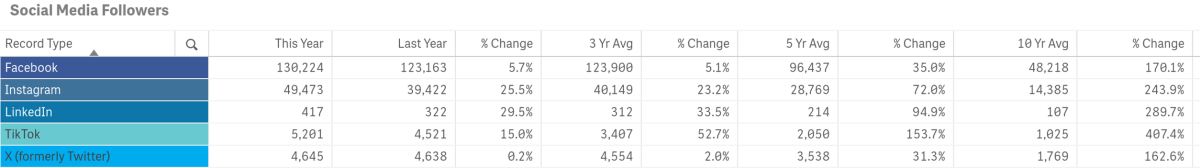
- Facebook followers are up year-over-year by 5.7%
- Instagram followers are up year-over-year by 25.5%
- LinkedIn followers are up year-over-year by 29.5%
- TikTok is up year-over-year by 15.0%.
- X followers are up year-over-year by 0.2%
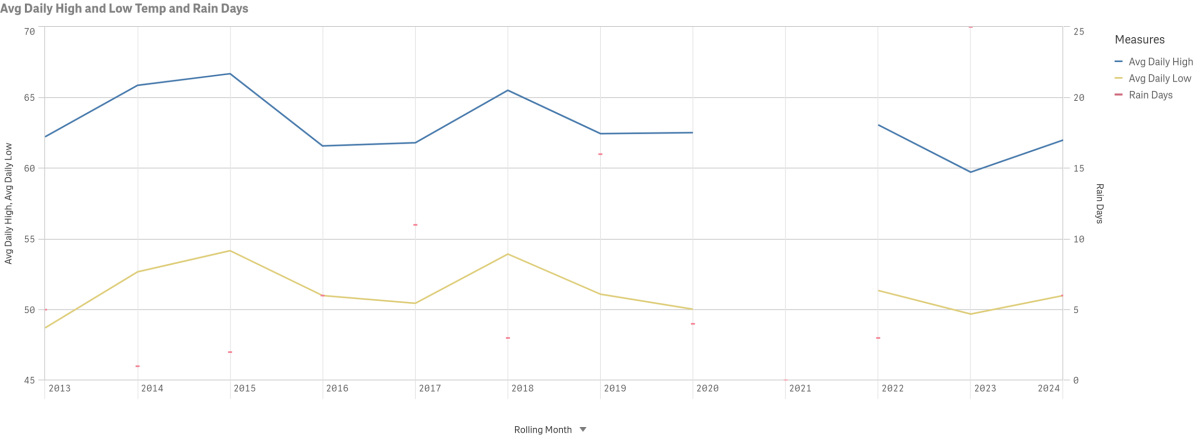
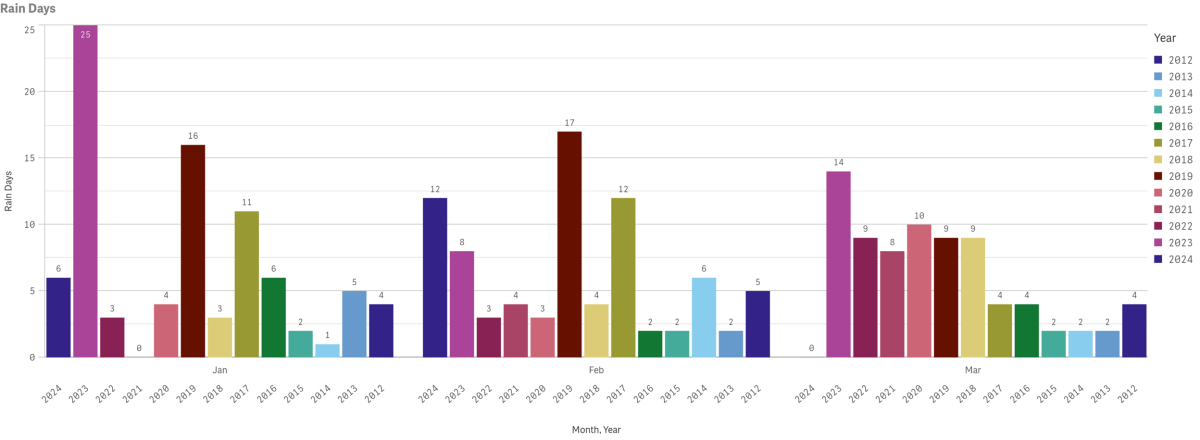
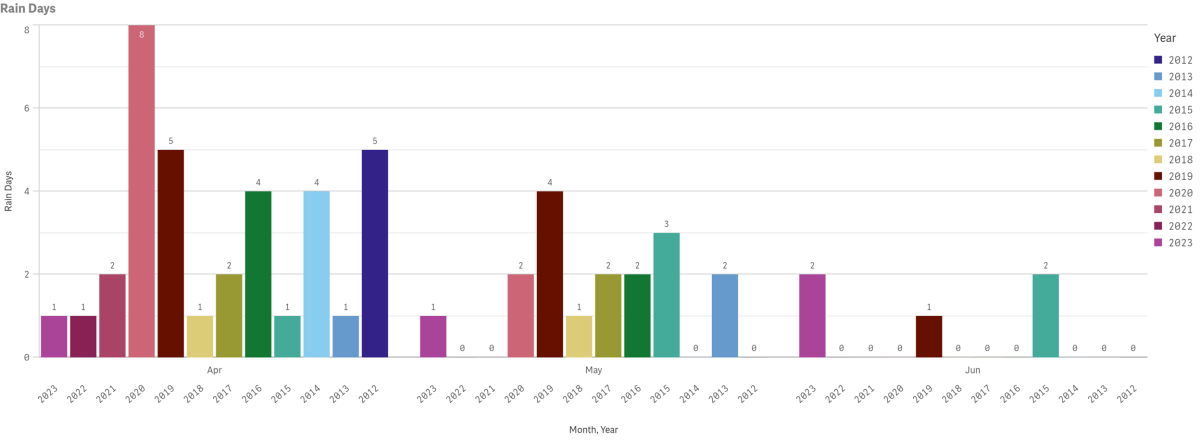
Weather
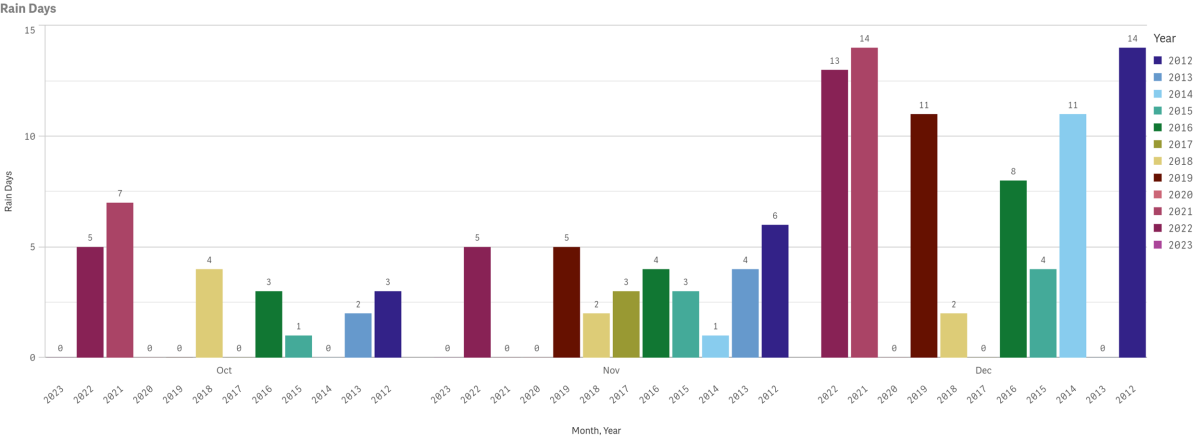
Data for recent highs, lows and precipitation are now being manually entered due to broken feed from the weather station. Missing data from 2020-21 on high and low temperatures is being searched for manual re-entry. Average Temperatures and Rain Days for the month of January are displayed below. Multi-year rain days data is displayed by year and month since 2012. Measures are taken at Avalon Harbor.


51st Annual New Year’s Eve Gala Celebration
Reservations are On Sale!
A sparkling night of evening gowns, tuxedos, champagne, dining and dancing on Tuesday, December 31 in the world-famous Casino Ballroom.


