
February 2022
All Arrivals
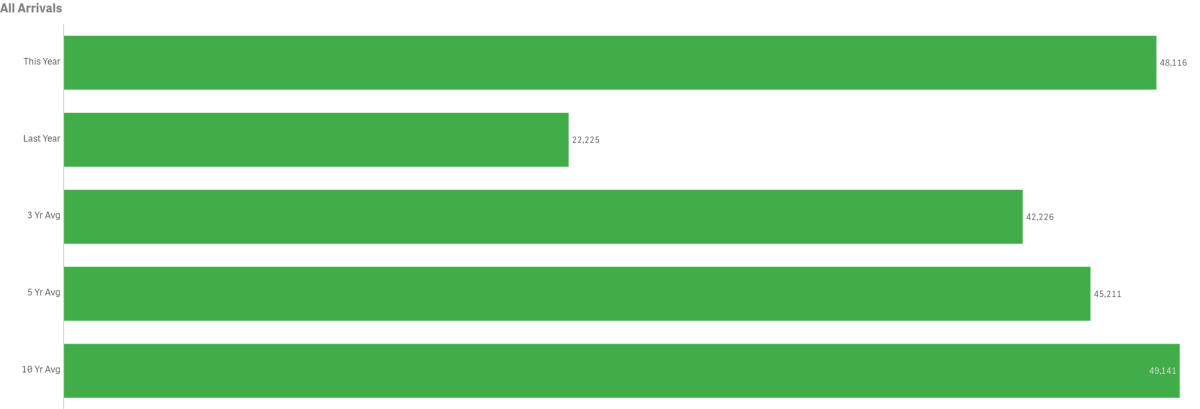
February visitation increased significantly year-over-year, with February 2021 being one of the extreme low points in visitation, Catalina saw in an overall increase by 116.5% or 25,891 visitors over the same month last year.
Previous tracking (below) for the month of February offers a comparison without COVID-19 impacts. February 2022’s total of 48,116 fell short of February 2020’s pre COVID-19 total arrivals of 56,336 by 8,220 visitors.
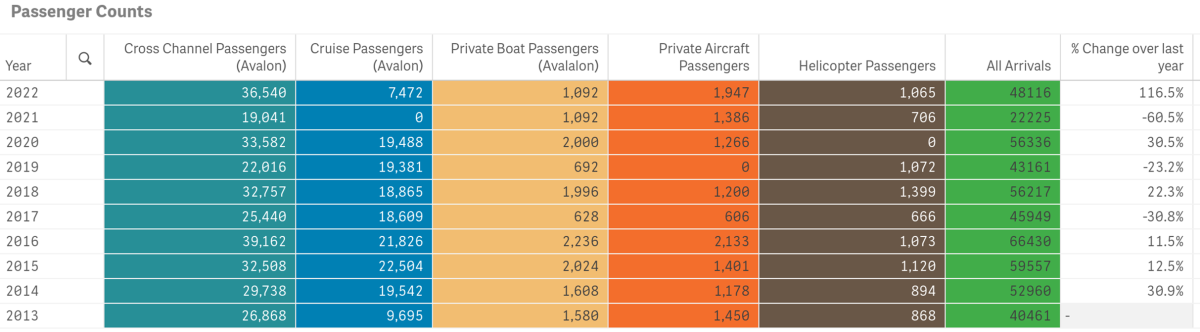
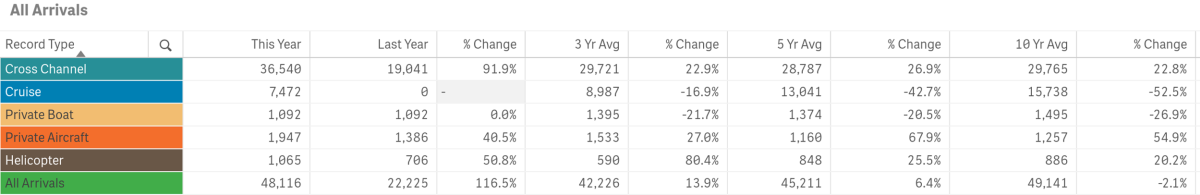
February’s total in-bound passenger count was above the three and five-year averages of 42,226 and 45,211 respectively but was still below the ten-year average of 49,141.
Arrivals by Sea
Passengers arriving by sea, totaled 45,104 for the month of February, up by 124% from last year.
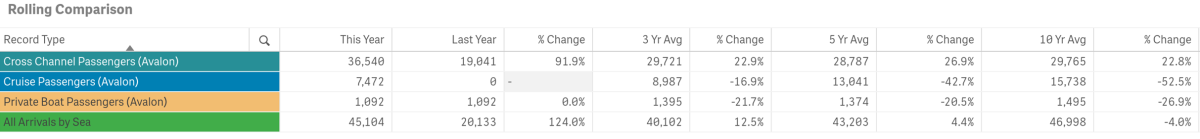
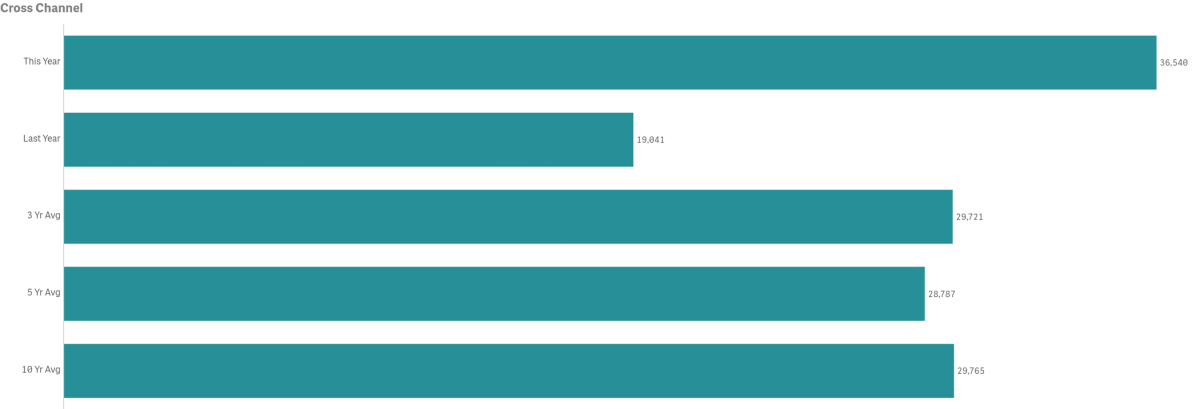
- February Cross Channel Passenger counts were up year-over-year by 91.9% or an increase of 17,499 people
- 2016 had the highest volume for the month @ 39,162 passengers
- 1998 had the lowest volume for the month @ 15,517
- February Cross Channel Passenger counts were above the three, five and ten-year averages by 22.9%, 26.9% and 22.8% respectively
- Cross Channel Passengers made up 75.96% of total monthly arrivals
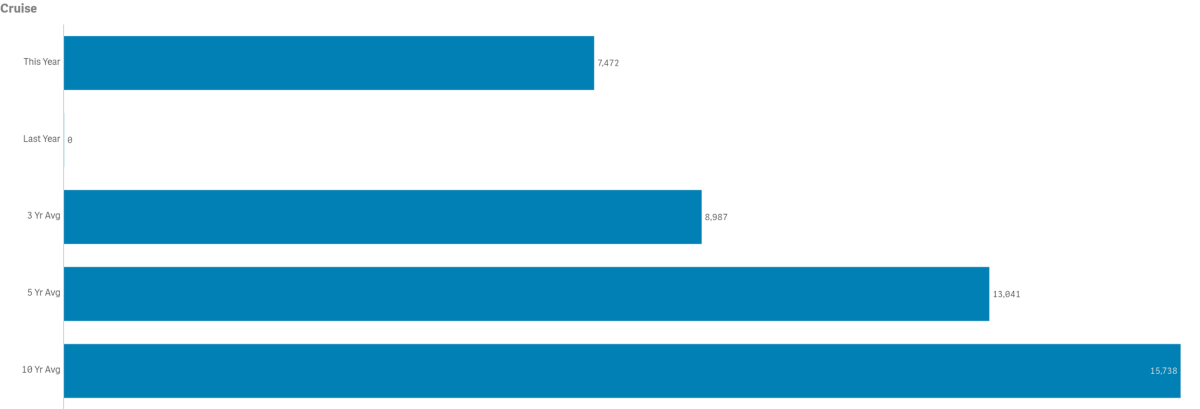
- Cruise passenger counts totaled 7,472
- There were no cruise passengers in February 2021
- 2006 had the highest Cruise Passenger volume for the month @ 22,927
- 2021 had the lowest Cruise Passenger volume for the month @ 0. Pre-COVID-19 the lowest count for the month was 1995 @1,089
- February Cruise Passenger counts were below the three, five and ten-year averages by 16.9%, 42.7% and 52.5% respectively
- Cruise Passengers made up 15.53% of total monthly arrivals
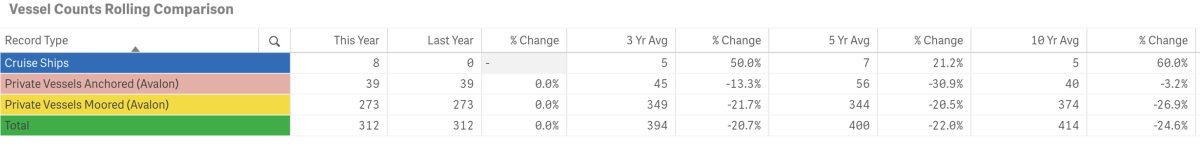
- The number of Cruise Ships calling on Avalon was 8
- 2016 and 2020 had the greatest number of ships @ 9
- 2021 had the lowest number of ships @ 0, pre-COVID-19 2018 and 2019 had the lowest number @ 8
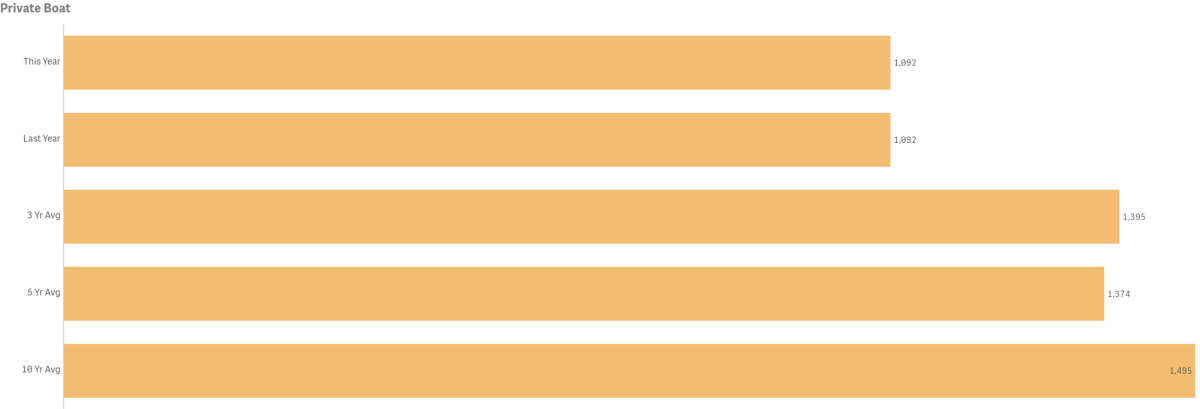
- Private Boater Passenger counts were on par with last year @ 1,092
- 2016 had the highest passenger volume for the month @ 2,236
- 2017 had the lowest passenger volume month @ 628
- February Private Boater Passenger counts were below three, five and ten-year averages by 21.7%, 20.5% and 26.9% respectively
- February’s number of Vessels Anchored was even with last year @ 39
- 2019 had the highest number of Vessels Anchored @ 104
- 2013 had the lowest number of Vessels Anchored @ 3
- February was below the average number of Vessels Anchored for three, five and ten-year averages by 13.3%, 30.9% and 3.2% respectively
- February’s number of Vessels on Moorings equal to last year @ 273
- 2016 had the highest number of Vessels on Moorings @ 595
- 2017 had the lowest number of Vessels on Moorings @ 157
- February was below three, five and ten-year averages for Vessels on Moorings by 21.7%, 20.5%, 26.9%
- Private Boaters Made up 2.27% of total monthly arrivals
Arrivals by Air
Combined in-bound air passenger counts for February totaled 3,052 up from 2,116 in 2021. 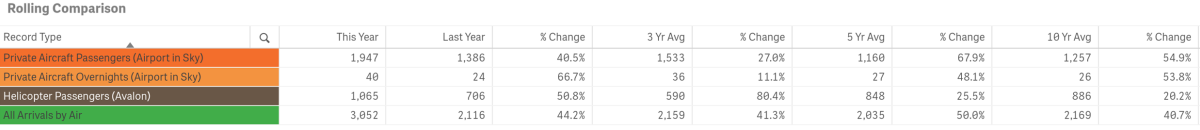
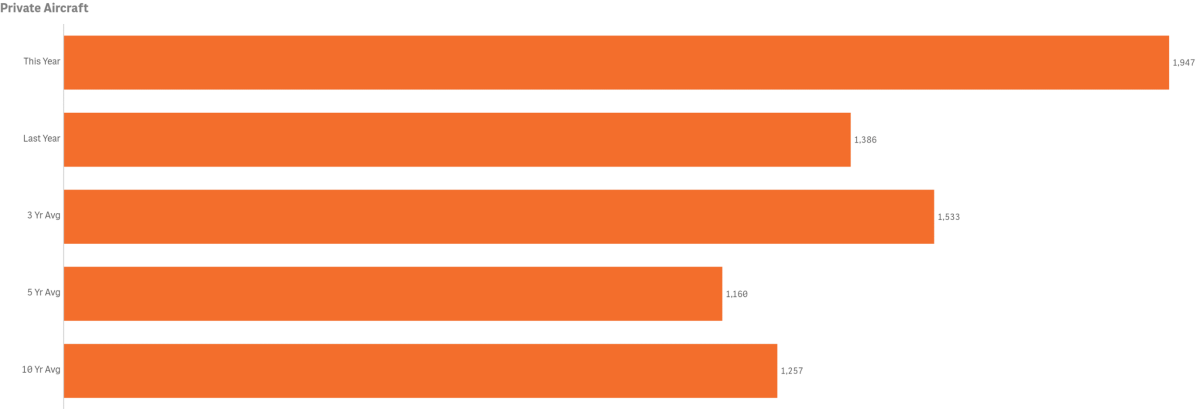
- Private Aircraft Passengers (Airport in the Sky) were up 40.5% @ 1,947 vs 1,386 last year
- 2016 had the highest volume of Private Aircraft Passengers for the month @ 2,133
- 2019 had the lowest volume of Private Aircraft Passengers for the month @ 0, due to closure for runway repairs
- 2017 had the lowest volume of Private Aircraft Passengers for the month when open @ 606
- February counts for Private Aircraft Passengers was above the three, five and ten-year averages by 27%, 67.9% and 54.9% respectively
- February Private Aircraft Passengers made up 4.05% of total monthly arrivals
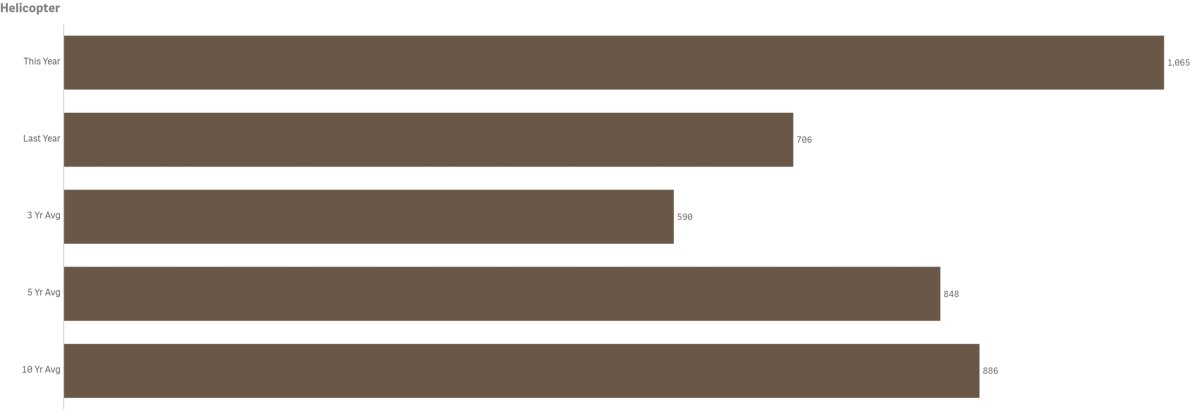
- Helicopter Passenger counts were up 50.8% year-over-year @ 1,065 vs. 706
- 2018 had the highest volume for the month @ 1,399
- 2020 had the lowest volume for the month @ 0 due to a temporary closure
- 2017 had the lowest volume for the month when open @ 666
- February counts for Helicopter Passengers was above the three, five and ten-year averages by 80.4%, 25.5% and 20.2% respectively
- February counts for Helicopter Passengers made up 2.21% of total monthly arrivals
Lodging
Hotel and Short-Term Rental Occupancy from Smith Travel and AIRDNA
- Hotel Occupancy for February was 66.7%, vs 48.7% reported in 2021
- February Hotel Occupancy exceeded San Francisco, Anaheim, Monterey, Huntington Beach, Santa Barbara and Newport Beach among our competing destinations. Those competing destinations all had occupancy above 47%.
- Hotel Average Daily Rate was $189.32 vs $130.62 in 2021
- Hotel Revenue Per Available Room was $126.30 vs $63.32 in 2021
- Short-Term Rental Occupancy for February was 43% vs 41% in 2021
- February Short-Term Rental Occupancy exceeded no destinations in our competitive set being below Palm Springs, Santa Barbara, San Diego, Newport Beach, Huntington Beach, Monterey, Anaheim, San Francisco and Santa Monica. All competing destinations had occupancy above 61%.
- Short-Term Rental Average Daily Rate was $508, up from $449 in 2021
- Short-Term Rental Revenue Per Available Room was $218, up from $184 in 2021
Visitor Services
February Visitor Services were up year-over-year.
Catalina Island Visitor Center

- Number of Phone Calls for the month was up year-over-year by 101.6% @ 516 vs. 256
- 2007 had the highest volume for the month @ 1,265 calls
- 2021 had the lowest volume for the month @ 256 calls. Pre-COVID-19 lowest call volume was 2020 @ 518
- February call counts were above the three and five-year averages by 20% and 4.2% respectively but below the ten-year average of 696

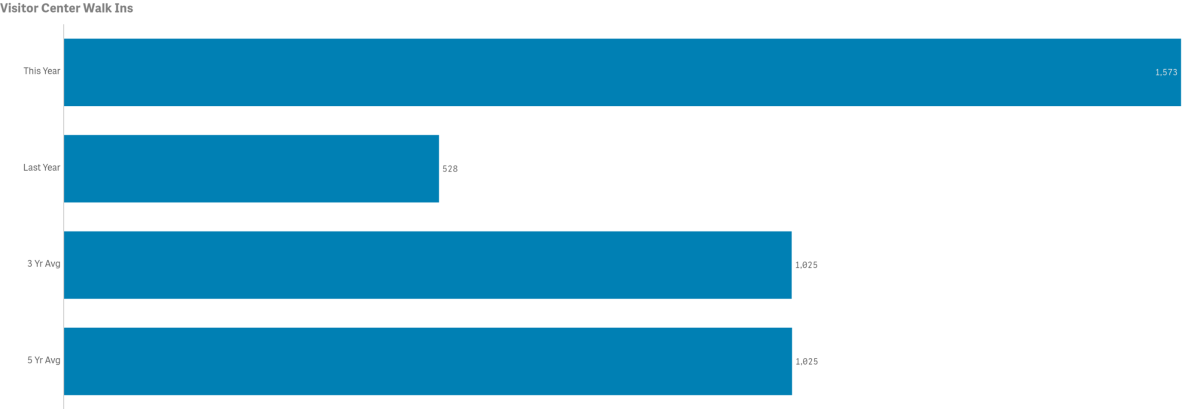
- Number of Walk-Ins for the month was up year-over-year @ 1,573 vs. 528
- 2022 had the highest volume of Walk-ins for the month @ 1,573 guests
- 2021 had the lowest volume of Walk-ins for the month @ 528 guests. Pre COVID-19 lowest volume of guests was 2017 @ 875
- February Walk-In counts were above the three and five-year average of 1,025
LoveCatalina.com
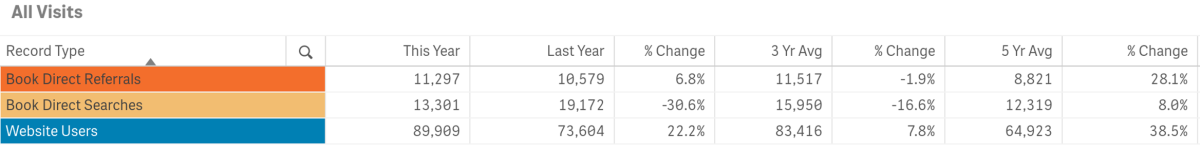
- February LoveCatalina.com website user numbers were up year-over-year by 22.2% @ 89,909 vs. 73,604 in 2021
- Website users were up 7.8% from the three-year average and 38.5% from the five-year average
- Website users are up despite suspension of a pay-per click campaign that is now reallocated to a co-op website
- Book Direct referrals were up year-over-year by 6.8% @ 11,297 vs. 10,579 in 2021
- Note changes to Book Direct on member links has resulted in shifting significant traffic to referrals vs. searches. As a result, Book Direct lodging searches were down by 30.6% @ 13,301 vs. 19,172 in 2021 but were still higher than both three and five-year averages.
Visitor Guides & Newsletters
- Note above numbers do not include racks and California Welcome Center/local Visitor Center distributions or trade show giveaways. Those measures will be added beginning with the initial reporting on 2022 guides as they become available.
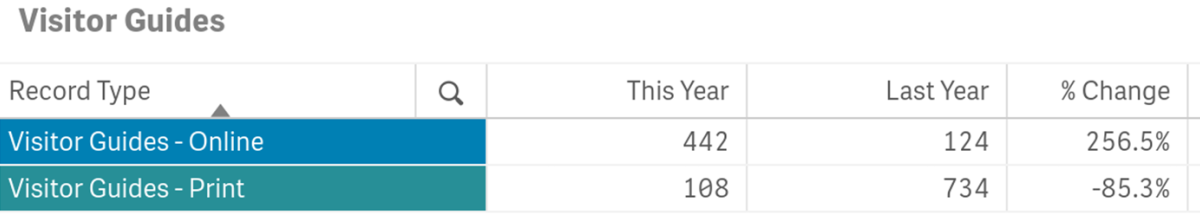
- Printed Visitor Guide orders @ LoveCatalina.com @ 108, down from 734 or 85.3% from last year
- No 2021 Guide was printed and 2022 guides distribution initiated in late February
- Online Guide downloads were up by 256.5% @ 442 vs. 124 in 2021
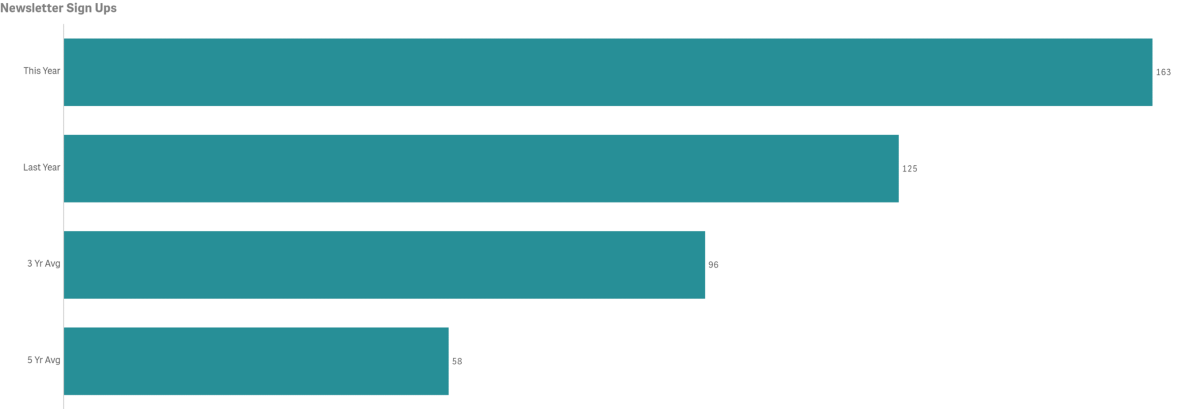
- New E-blast subscribers in February were up year-over-year @ 163 vs 125 in 2021
- New subscribers exceeded three and five-year averages
Cumulative totals by platform as of February below.
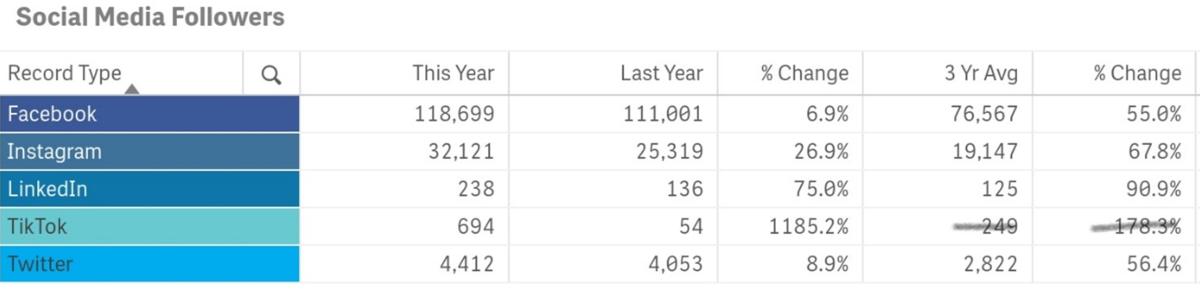
- Facebook followers are up year-over-year by 6.9%
- Instagram followers are up year-over-year by 26.9%
- Twitter followers are up year-over-year by 8.9%
- LinkedIn followers are up year-over-year by 75%
- TikTok is our newest platform and is up year-over year by1,185.2%. TikTok has less than three years data compiled.
Year-to-Date Measures
Total year-to-date arrivals are up from last year by 166.7%.
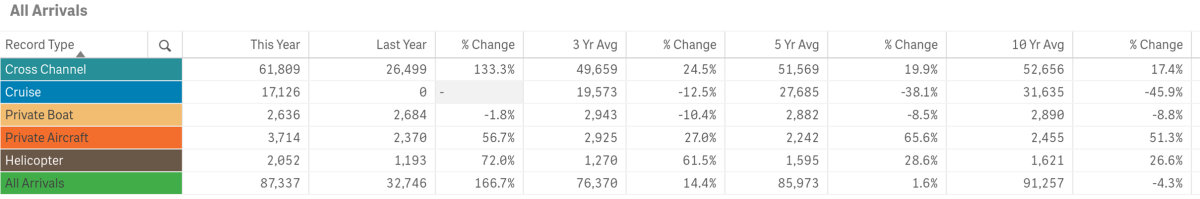
- Total Arrivals year-to-date was up @ 87,337 vs. 32,746 last year or a difference of 54,591 visitors
- Total Arrivals year-to-date exceeded the three-year average of 76,370 by 14.4%
- Total Arrivals year-to-date exceeded the five-year average of 85,973 by 1.6% but remained below the ten-year average of 91,257 by 4.3%
- All arrival sectors are up year-to-date with the exception of Cruise and Private Boat
Year-to-Date—Historical Arrivals
COVID-19 and pre-Covid-19 comparison data is illustrated in the ten-year snapshot below (January and February combined).
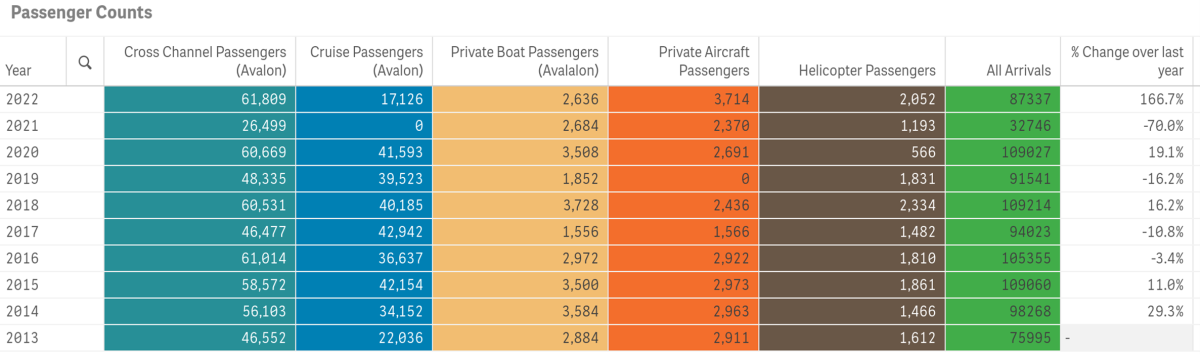
- 2018 had the highest total visitation year-to-date @ 109,214
- 2021 had the lowest year-to-date total visitation @ 32,746
- 2013 had the lowest pre COVID-19 year-to-date @ 75,995
To view historical data for total arrivals by sector, year and month in a spreadsheet form click here. PDF File.
Year-to-date Lodging
Hotel and Short-Term Rental Occupancy from Smith Travel and AIRDNA
- Hotel Occupancy YTD was 57.2%, with incomplete data available for the same time period in 2021
- YTD Hotel Occupancy exceeded San Francisco, Monterey, Huntington Beach, Newport Beach and Santa Barbara. Competing destinations of Palm Springs, San Diego, Anaheim and Santa Monica exceeded our year-to-date hotel occupancy.
- Short-Term Rental Occupancy Year-To-Date was 32%, down from 38% in 2021
- YTD Short-Term Rental Occupancy exceeded no destinations in our competitive set being below Palm Springs, Santa Barbara, San Diego, Newport Beach, Huntington Beach, Monterey, Anaheim, San Francisco and Santa Monica
Year-to-date Visitor Services
Catalina Island Visitor Center

- Number of Phone Calls year-to-date are up by 90.9% @ 897 vs. 470
- Year-to-date Phone Calls exceeded the three-year average but remained below five and ten-year averages
- Number of Walk-Ins year-to-date are up @ 2,943 vs. 530 or 455.3%
- Year-to-date Walk-In counts were above the three, five and ten-year averages
Year-to-date LoveCatalina.com
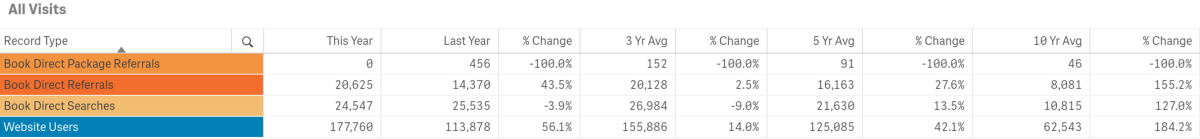
- LoveCatalina.com website users are up year-to-date by 56.1% @ 177,760 vs. 113,878 in 2021
- Book Direct lodging searches are down year-to-date by 3.9% @, 24,547 vs. 25,535 in 2021. Note changes to Book Direct on member links has resulted in shifting more traffic to referrals vs. searches
- Book Direct referrals year-to-date are up by 43.5% @ 20,625 vs.14,370 in 2021
- Book Direct Package referrals is not currently active on our site
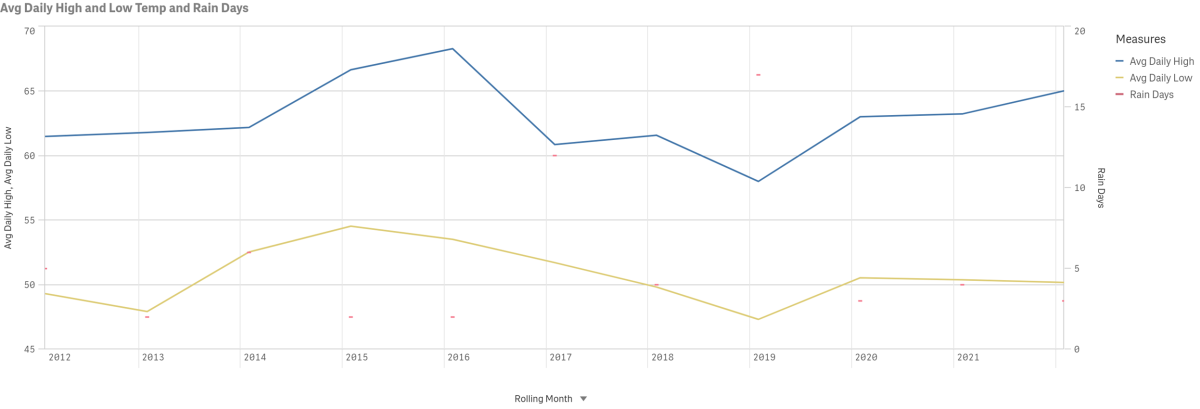
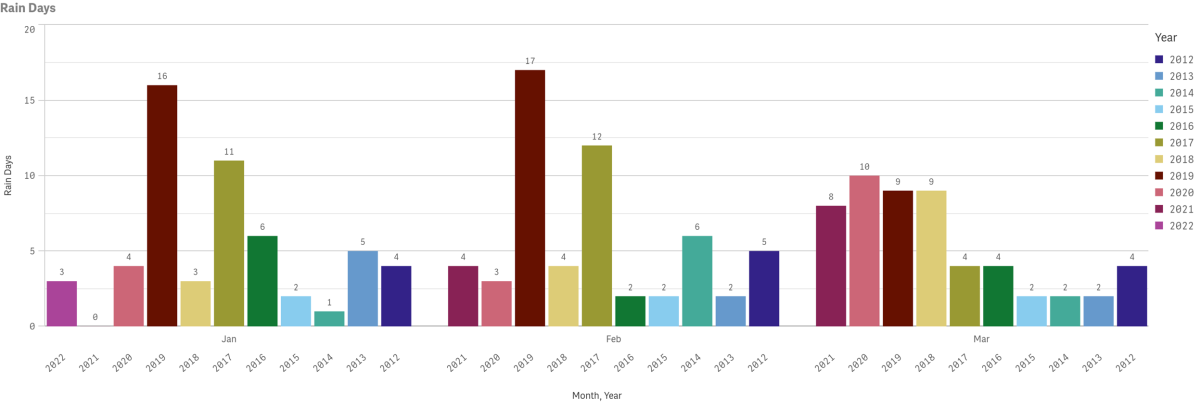
Weather
Data for February highs, lows and precipitation going back to 2013 is displayed below. Multi-year rain days data is also displayed by year and month since 2012. Measures are taken at Avalon Harbor.


51st Annual New Year’s Eve Gala Celebration
Reservations are On Sale!
A sparkling night of evening gowns, tuxedos, champagne, dining and dancing on Tuesday, December 31 in the world-famous Casino Ballroom.


