July 2022
All Arrivals
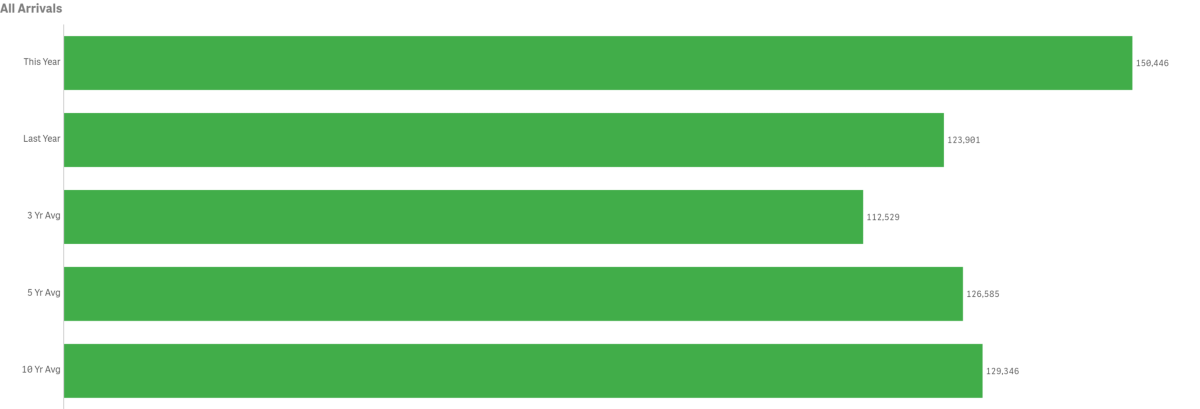
July visitation increased year-over-year by 21.4% or 26,545 visitors
Previous tracking (below) for the month of July offers a comparison with and without COVID-19 impacts. July’s 2022’s total of 150,446 exceeded July 2019’s pre COVID-19 total arrivals of 146,219 by 4,227 visitors.
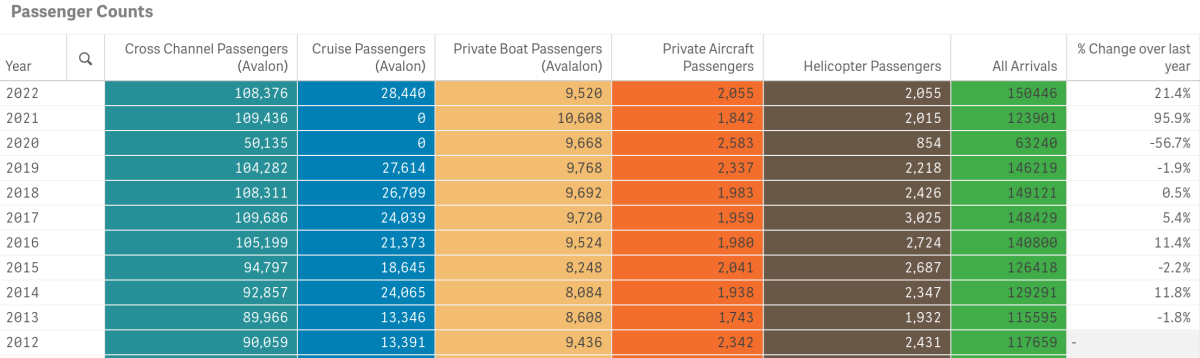
July’s total in-bound passenger count was above the three, five and ten-year averages of 112,529, 126,585 and 120,346 respectively.
Arrivals by Sea
Passengers arriving by sea, totaled 146,336 for the month and were up 21.9% from last year.
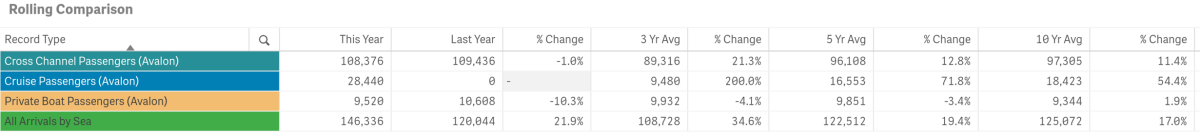
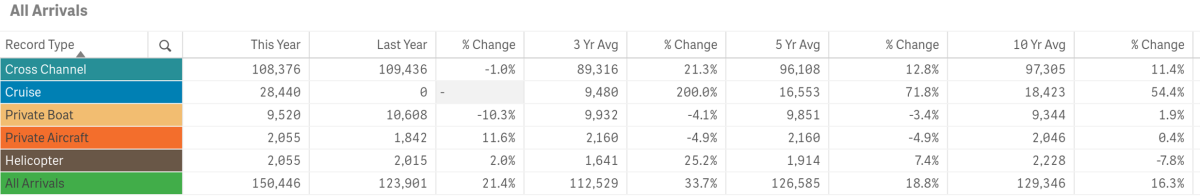
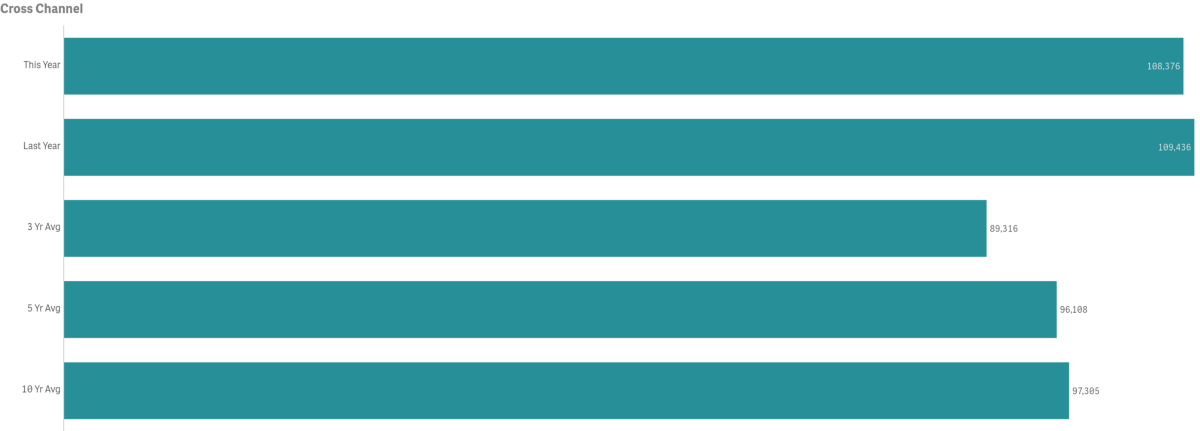
Cross Channel Passenger counts were down year-over-year by 1.0% or a decrease of 1,060 people
- 2000 had the highest volume for the month @ 117,097 passengers
- 2020 had the lowest volume for the month @ 50,135. Pre COVID-19, the lowest year for the month was 2009 @ 72,367
- July Cross Channel Passenger counts were above the three, five and ten-year averages by 21.3%, 12.8% and 11.4% respectively
- Cross Channel Passengers made up 72.1% of total monthly arrivals
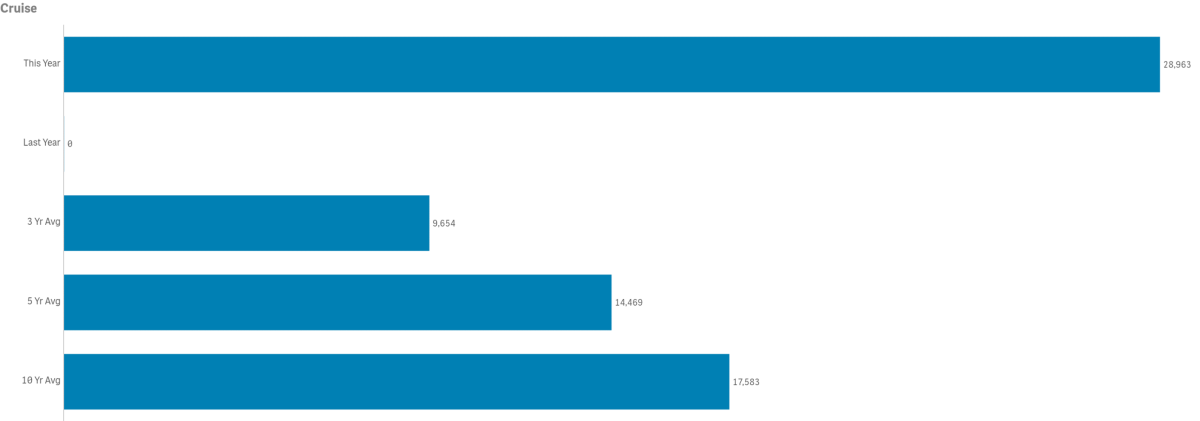
Cruise passenger counts totaled 28,440
- There were no cruise passengers in July 2020 or 2021
- 2022 had the highest Cruise Passenger volume for the month @ 28,440
- 2020 and 21 had the lowest Cruise Passenger volume for the month @ 0. Pre-COVID-19 the lowest count for the month was 2010 @ 10,512
- Pre-COVID-19, July 2019 brought 27,614 visitors via cruise ships
- July Cruise Passenger counts were above the three and five and ten-year averages by 200%, 71.8% and 59.4% respectively. Note with two years of few/no cruise ship calls, multi-year averages are greatly impacted
- Cruise Passengers made up 18.9% of total monthly arrivals
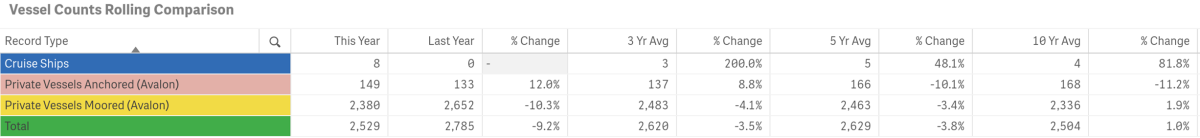
- The number of Cruise Ships calling on Avalon was 8
- 2019 had 10 ships call on us
- 2020 and 21 had 0
- Pre-COVID-19 the lowest count for the month was 8 in 2016
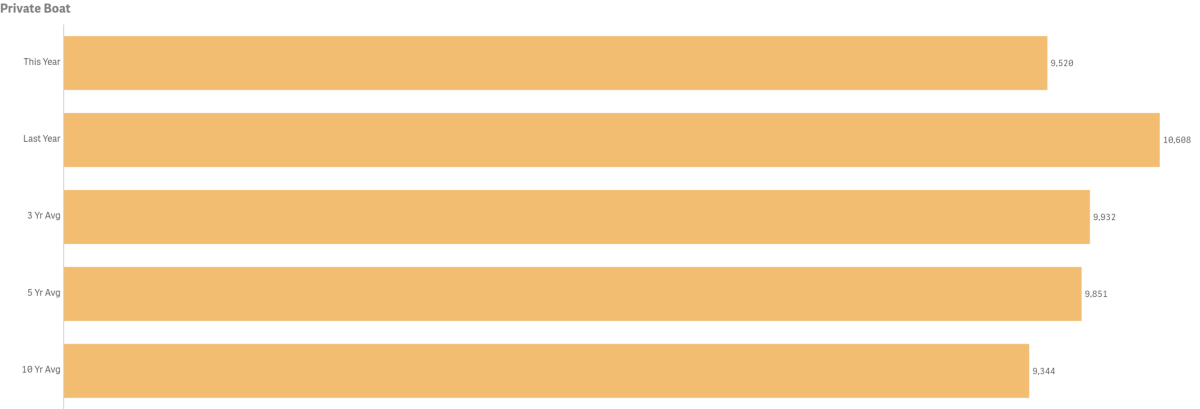
Private Boater Passenger counts were down from last year by 10.3% @ 9,520 vs. 10,608
- 2021 had the highest passenger volume for the month @ 10,608
- 2014 had the lowest passenger volume month @ 8,084
- July Private Boater Passenger counts were below the three and five-year averages by 4.1% and 3.4% respectively, but above the ten-year average by 1.9%
- Private Boaters Made up 6.3% of total monthly arrivals
- July’s number of Vessels Anchored was up 12% @ 149 vs 133 last year
- 2018 had the highest number of Vessels Anchored @ 213
- 2020 had the lowest number of Vessels Anchored @ 129
- July was above the three-year average by 8.8% but below the average number of Vessels Anchored for five and ten-years by 10.1% and 11.2% respectively
- July’s number of Vessels on Moorings was down 10.3% from last year @ 2,380 vs 2,652
- 2021 had the highest number of Vessels on Moorings @ 2,652
- 2014 had the lowest number of Vessels on Moorings @ 2021
- July was below the three and five-year averages for Vessels on Moorings by 4.1% and 3.4% respectively, but above the ten-year average by 1.9%
Arrivals by Air
Combined in-bound air passenger counts for July totaled 4,222 up 7.3% from 3,934 in 2021. 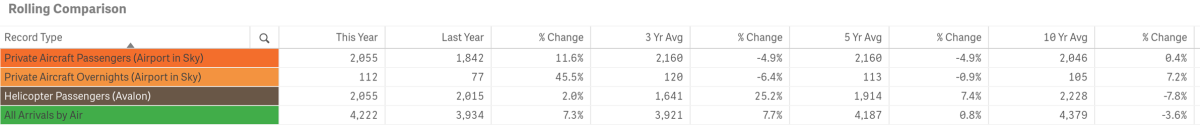
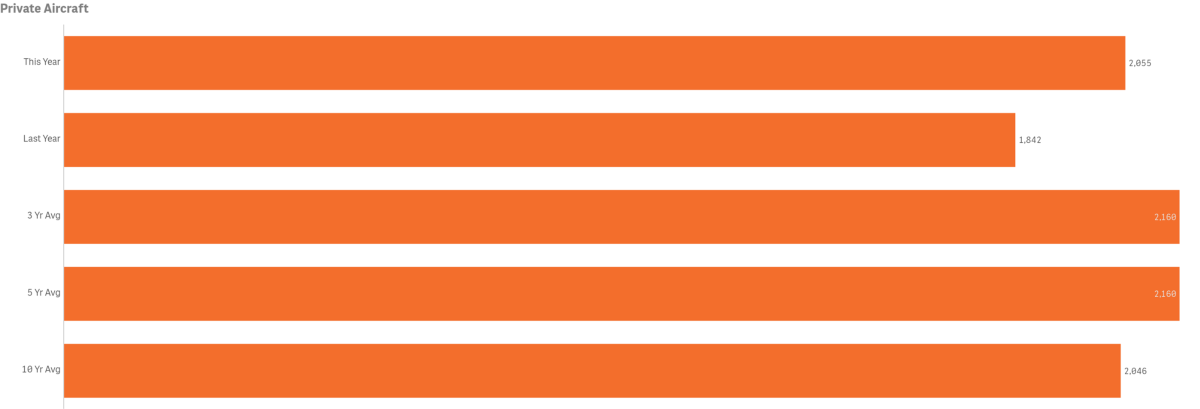
Private Aircraft Passengers (Airport in the Sky) were up @ 2,055 vs 1,842 last year
- 2020 had the highest volume of Private Aircraft Passengers for the month @ 2,583
- 2010 had the lowest volume of Private Aircraft Passengers for the month @ 1,455
- July’s Private Aircraft Passenger count was below the three and five-year averages by 4.9% each and slightly above the ten-year average by 0.4%
- July Private Aircraft Passengers made up 1.37% of total monthly arrivals
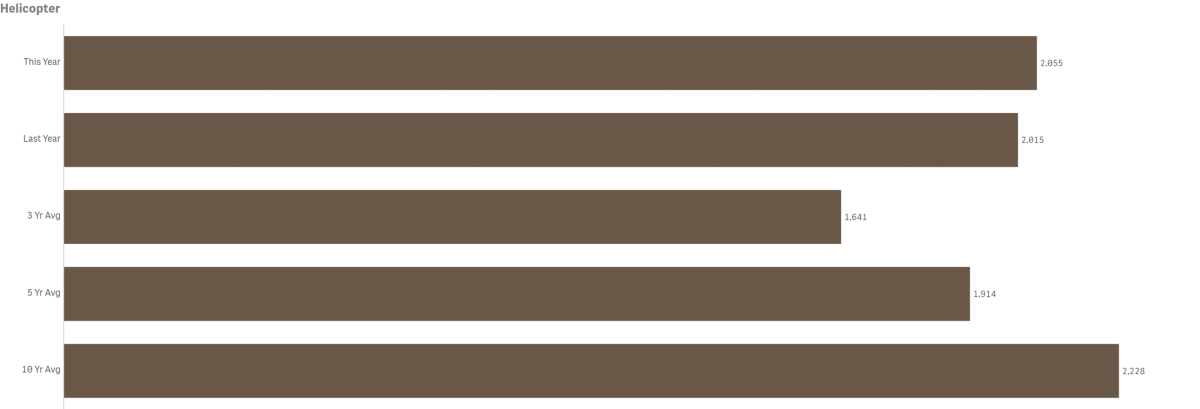
Helicopter Passenger counts were up year-over-year @ 2,055 vs. 2,015
- 2017 had the highest volume for the month @ 3,025
- 2020 the lowest volume for the month @ 854. Pre COVID-19 the lowest for the month was 2009 @ 1,767
- July Helicopter Passengers counts were above the three and five-year averages by 25.2% and 7.4% respectively, but below the ten-year average by 7.8%
- July Helicopter Passengers made up 1.37% of total monthly arrivals
Lodging
Hotel and Short-Term Rental Occupancy from Smith Travel and AIRDNA

- Hotel Occupancy for July was up by 9.3% @ 71.4% vs. 65.3% in 2021
- Hotel Occupancy was above the three-year average by 7.0% and the five-year average by 2.1%
- Short-Term Rental Occupancy for July was up 2.6% @ 58.5% vs 57.1% in 2021
- Short-term rental occupancy was above the three and five-year averages by 19.9% and 39% respectively
Competing Destination Occupancies
- Among our competitive set, Catalina ranked 1st in Hotel and STR Occupancy

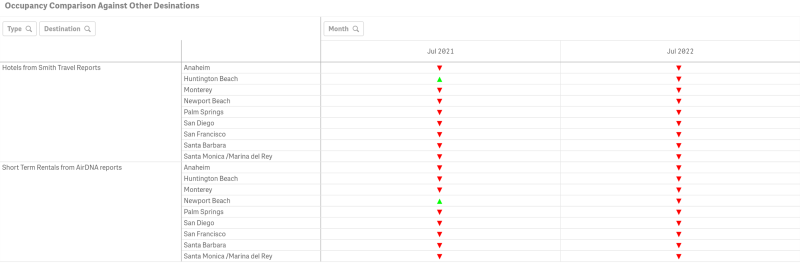
- July Hotel Occupancy was greater than Catalina’s none of our competing destinations
- July Short-Term Rental Occupancy was greater than Catalina’s in none of our competing destinations
Hotel and Short-Term Rental Average Daily Rate from Smith Travel and AIRDNA
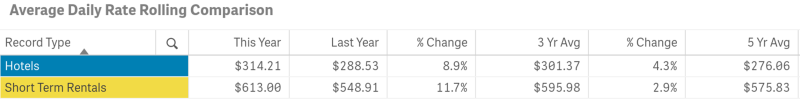
- Among our competitive set, Catalina ranked 5th in Average Daily Rate for Hotels and 2nd in Average Daily Rate for STRs
- July Hotel Average Daily Rate was up 8.9% @ $314.21 vs. $288.53 in 2021
- July Short-Term Rental Average Daily Rate was up 11.7% @ $613, up from $548.91 in 2021
Hotel and Short-Term Rental Revenue Per Available Room from Smith Travel and AIRDNA
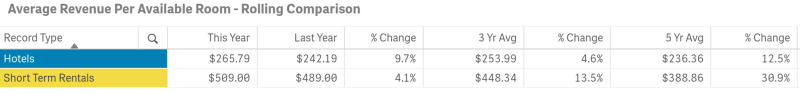
- Among our competitive set, Catalina ranked 5th for hotels and 2nd for STRs respectively in Revenue Per Available Room.
- July Hotel Revenue Per Available Room was up 9.7% @ $265.79 vs. $242.19 in 2021
- July Short-Term Rental Revenue Per Available Room was $509.00, up 4.1% from $489.00 in 2021
Visitors Services
Catalina Island Visitor Center

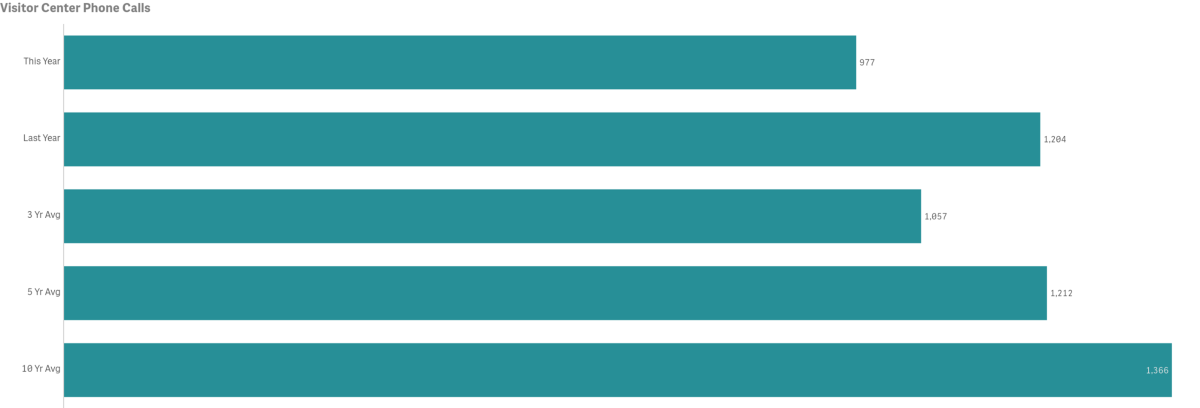
- Phone Calls for the month were down year-over-year by 18.9% @ 977 vs. 1,204 in 2021
- 2008 had the highest volume for the month @ 3,001 calls
- 2022 had the lowest volume for the month @ 977 calls.
- July call counts were below the three, five and ten-year averages by 7.6%, 19.4% and 28.5% respectively
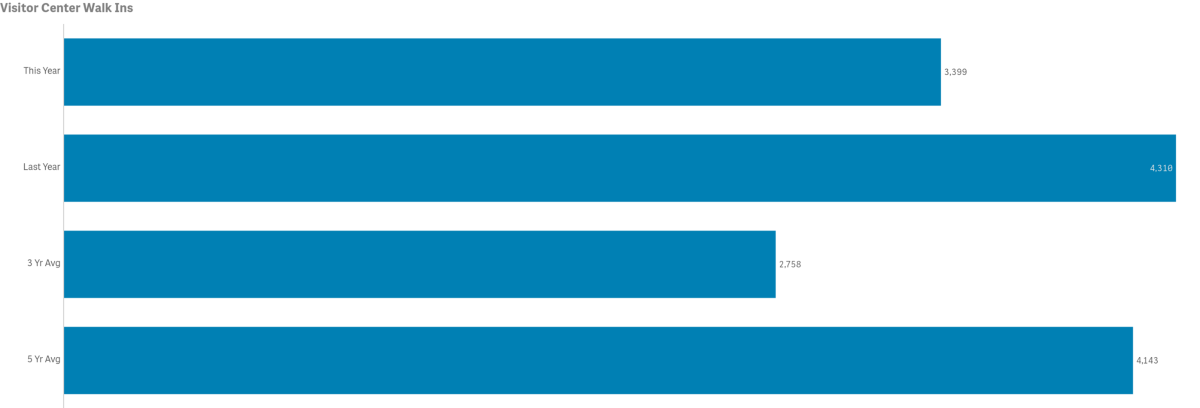
- The number of Walk-Ins for the month was down by 21.1% year-over-year @ 3,399 vs. 4,310 in 2021
- 2018 had the highest volume of Walk-ins for the month @ 8,597 guests
- 2020 had the lowest volume of Walk-ins for the month @ 566 guests.
- July Walk-In counts were above the three-year average of 2,758 by 23.2% but below the five-year average of 4,143 by 18%
LoveCatalina.com
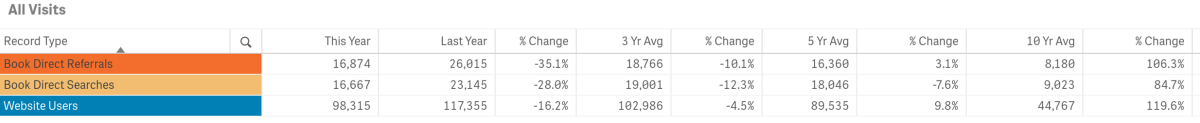
- July LoveCatalina.com website users were down year-over-year by 16.2% @ 96,315 vs. 117,355 in 2021
- Website users were below the three-year average by 4.6% but above the five and ten-year averages by 9.8% and 119.6% respectively
- Book Direct referrals were down year-over-year by 35.1% @ 16,874 vs. 26,015 in 2021
- Book Direct lodging searches were down 28% @ 16,667 vs. 23,145 in 2021
Note changes to Book Direct on member links has resulted in shifting traffic between referrals and searches
Visitor Guides & Newsletters
Note measures now include additional source tracking for months and years in which distributions were tracked
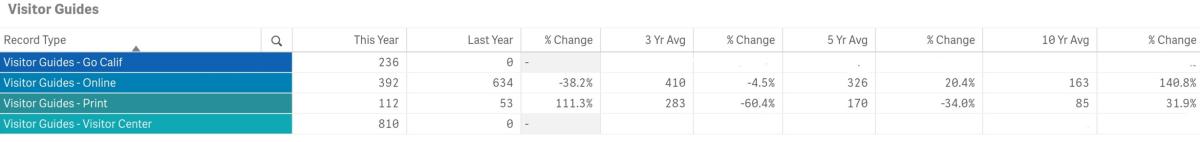
- Printed Visitor Guide orders on LoveCatalina.com @ 112, were up from 53 last year
- No 2021 Guide was printed and 2022 guide distribution initiated in late February 2022
- Online Guide downloads were down by 38.2% @ 392 vs. 634 in 2021 when no print version was available
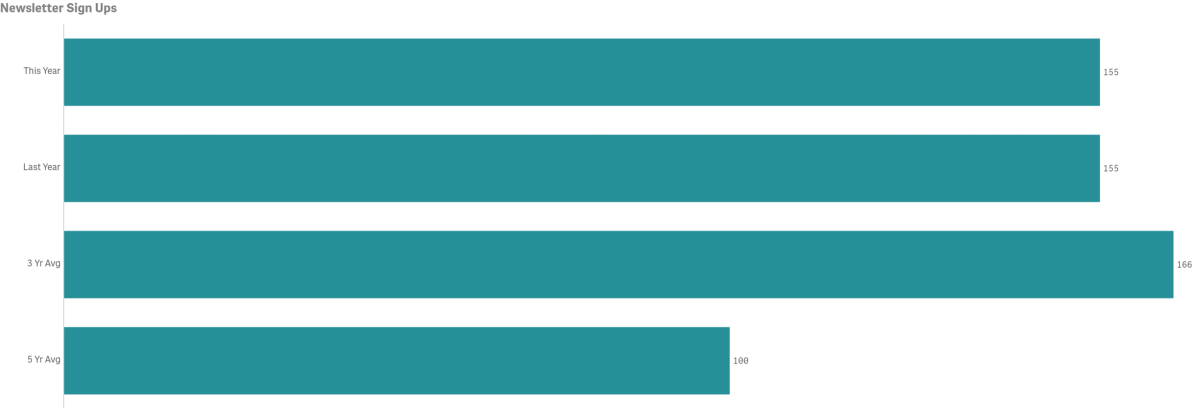
- New E-newsletter subscribers in July were equal year-over-year @ 155
- New subscribers were below the three-year average of 166 but above the five-year average of 100
Social Media
Cumulative totals by platform as of July below.
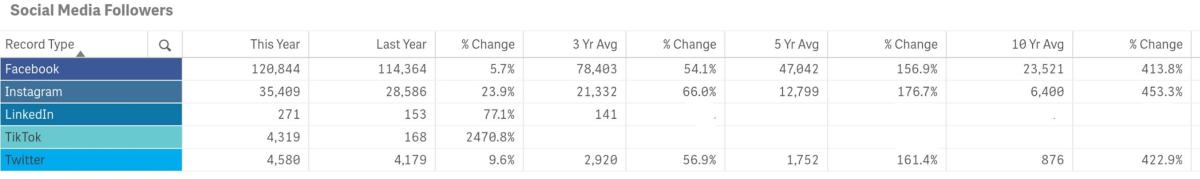
- Facebook followers are up year-over-year by 5.7%
- Instagram followers are up year-over-year by 23.9%
- Twitter followers are up year-over-year by 9.6%
- LinkedIn followers are up year-over-year by 77.1%
- TikTok is our newest platform and is up year-over year by 2,470.8%.
Year-to-Date Measures
Total year-to-date arrivals are up from last year by 43.3%
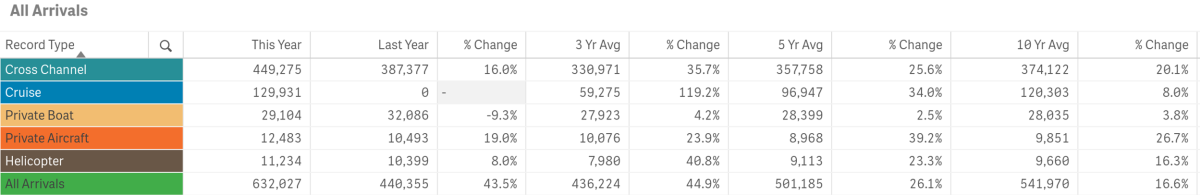
- Year-to-date Total Arrivals were up @ 632,027 vs. 440,355 last year or a difference of 191,672 visitors
- The total arrivals year-to-date exceeded the three-year average of 436,224 by 44.9%, five-year average of 501,185 by 26.1% and ten-year average of 541,970 by 16.6%
- All arrival sectors are up year-to-date with the exception of Private Boat
Year-to-Date—Historical Arrivals
COVID-19 and pre-Covid-19 comparison data is illustrated in the ten-year plus snapshot below (January - July combined).
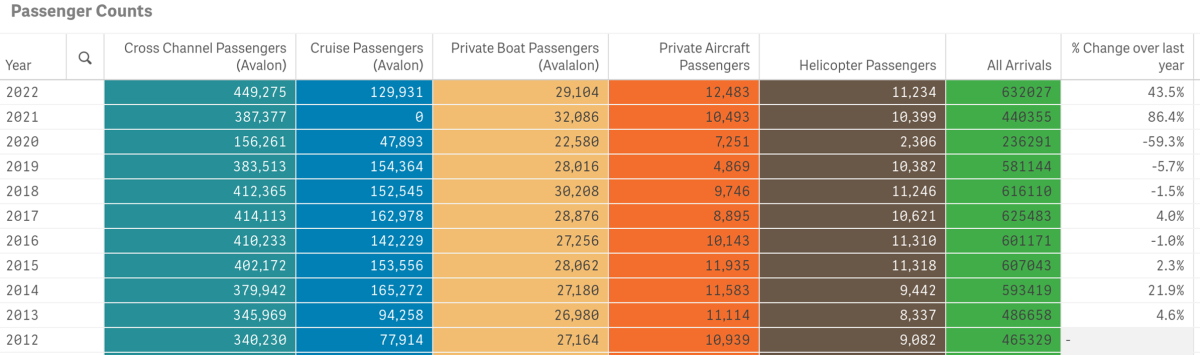
- 2022 has the highest total visitation year-to-date @ 632,027
- 2020 had the lowest year-to-date total visitation @ 236,291
To view historical data for total arrivals by sector, year and month in a spreadsheet form click here.
Year-to-date Lodging
Hotel and Short-Term Rental Occupancy from Smith Travel and AIRDNA

- Hotel Occupancy YTD is 71.4% vs. 60.3% tracked for the same time period in 2021
- Short-Term Rental Occupancy Year-To-Date is 58.5%, up from 56.9% in 2021
- According to Smith Travel, YTD Catalina’s average Hotel Occupancy of 71.4% was above Anaheim, Huntington Beach, Monterey, Newport Beach, Palm Springs and San Francisco. We are equal to Santa Barbara. Competing destinations of San Diego and Santa Monica exceeded our year-to-date average Hotel Occupancy.
- According to AirDNA, Catalina’s average Year-To-Date Short-Term Rental Occupancy has now moved above all destinations in our competitive set with the exception of Newport Beach, where we are tied at 78% occupancy.
Year-to-date Visitor Services
Catalina Island Visitor Center

- Number of Phone Calls year-to-date are up by 3.3% @ 4,881 vs. 4,659
- Year-to-date Phone Calls exceeded the three-year average, but remained below the five and ten-year average
- Number of Walk-Ins year-to-date are up @ 13,827 vs. 12,542 or 10.2%
- Year-to-date Walk-In counts were above the three-year average, but below the five-year average
Year-to-date LoveCatalina.com
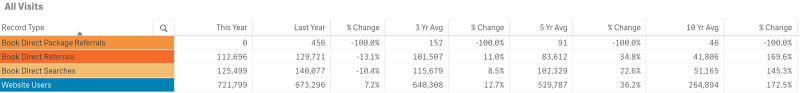
- LoveCatalina.com website users are up year-to-date by 7.2% @ 721,799 vs. 673,296 in 2021
- Book Direct lodging searches are down year-to-date by 6.9% @, 108,832 vs. 116,932 in 2021. Note changes to Book Direct on member links has resulted in shifting some traffic to referrals vs. searches
- Book Direct referrals year-to-date are down by 7.6% @ 95,982 vs. 103,706 in 2021
- Book Direct Package referrals are not currently active on our site
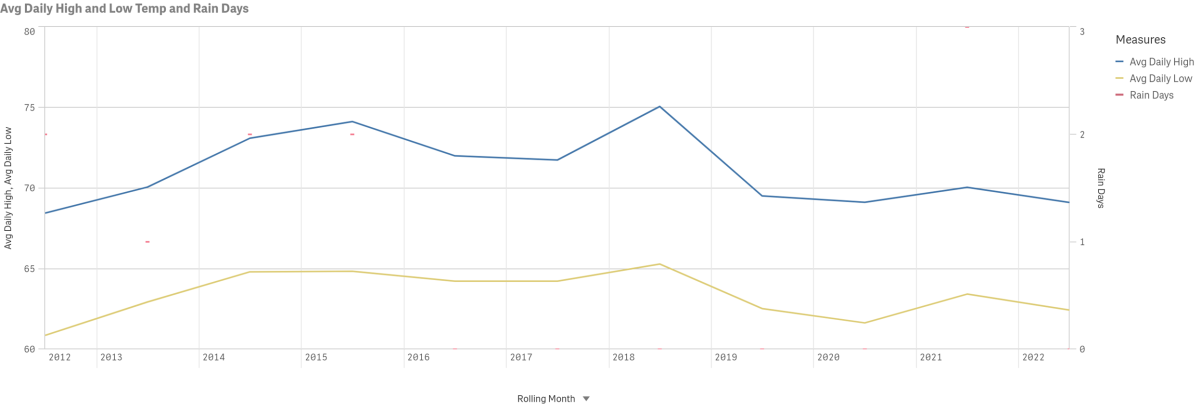
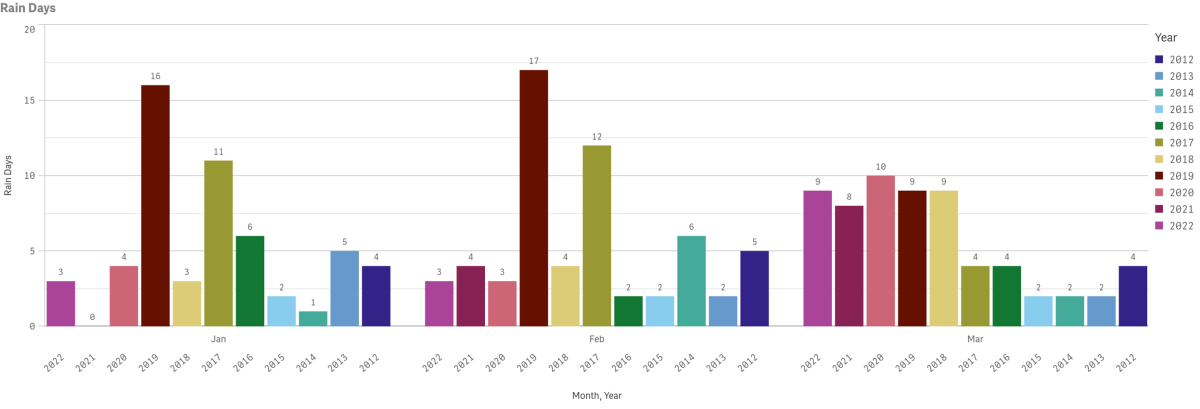
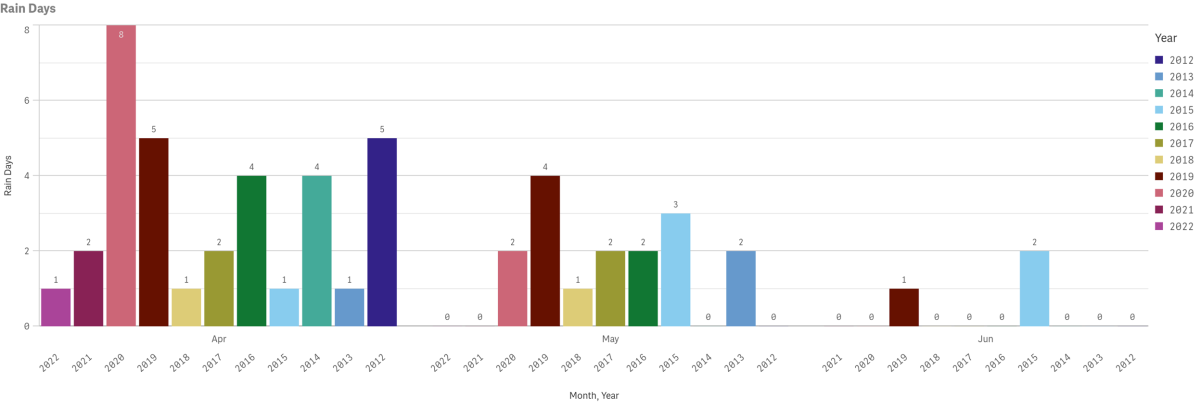
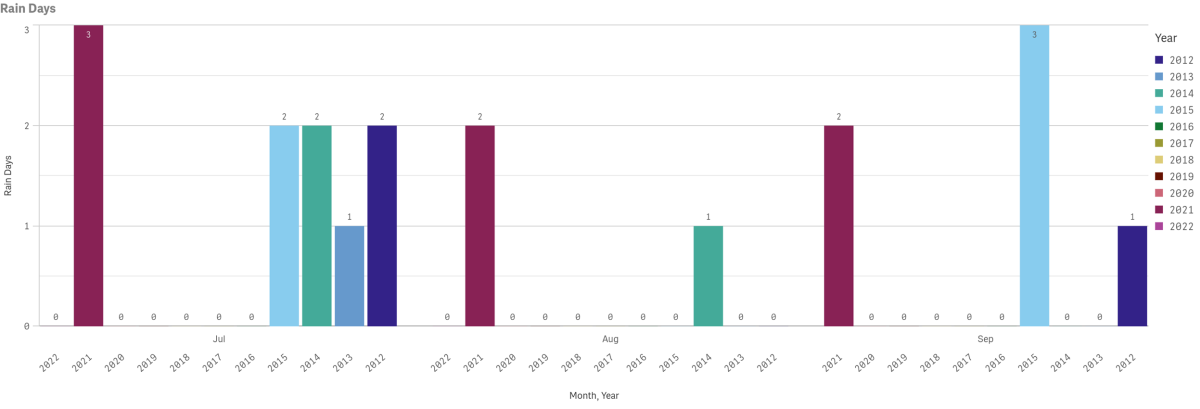
Weather
Data for July highs, lows and precipitation going back to 2012 is displayed below. Multi-year rain days data is also displayed by year and month since 2012. Measures are taken at Avalon Harbor.