January 2023
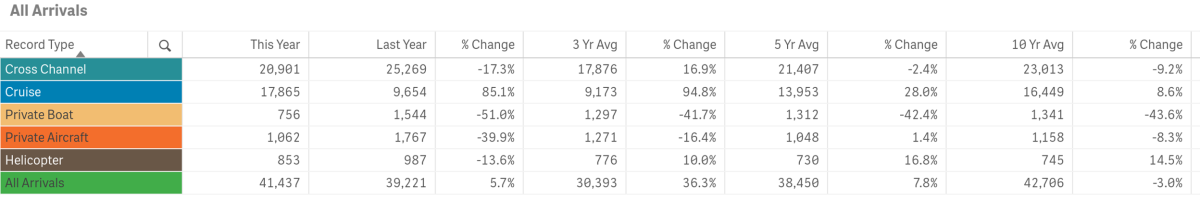
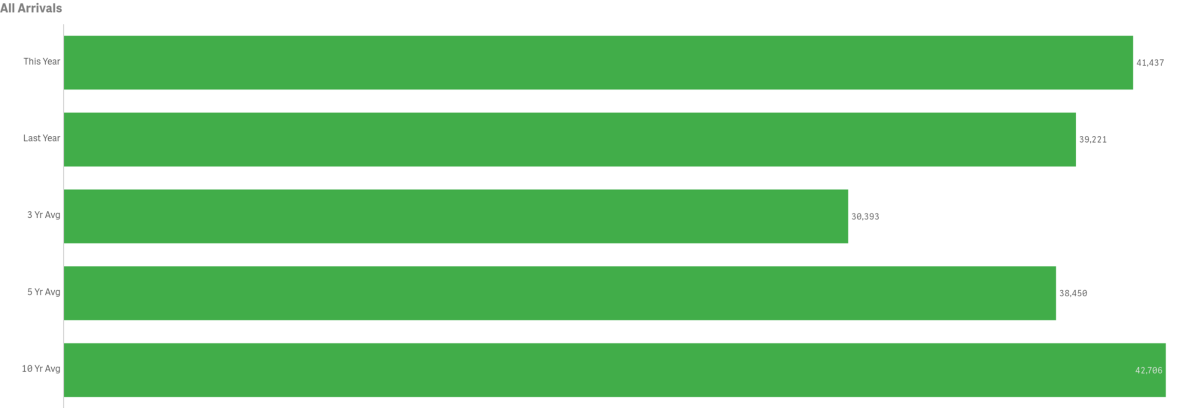
All Arrivals
January visitation increased year-over-year by 5.7% or 2,226 visitors
Previous tracking (below) for the month of January offers a comparison with and without COVID-19 impacts. January 2023’s total of 41,437 was below 2020’s pre COVID-19 total monthly arrivals of 52,691 by 11,254 visitors. January 2023 was below the peak visitation for the month in 2018 of 52,997 by 11,560 travelers.
January’s total in-bound passenger count was above the three and five-year averages but below the ten-year average.
Arrivals by Sea
Passengers arriving by sea, totaled 39,522 for the month, an increase of 8.4% from last year.
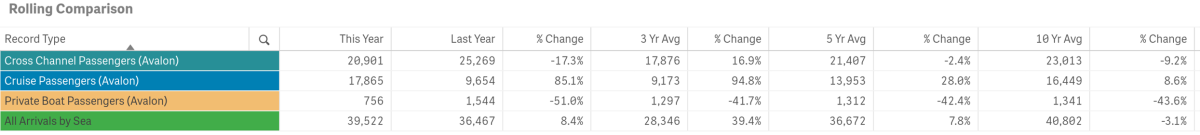
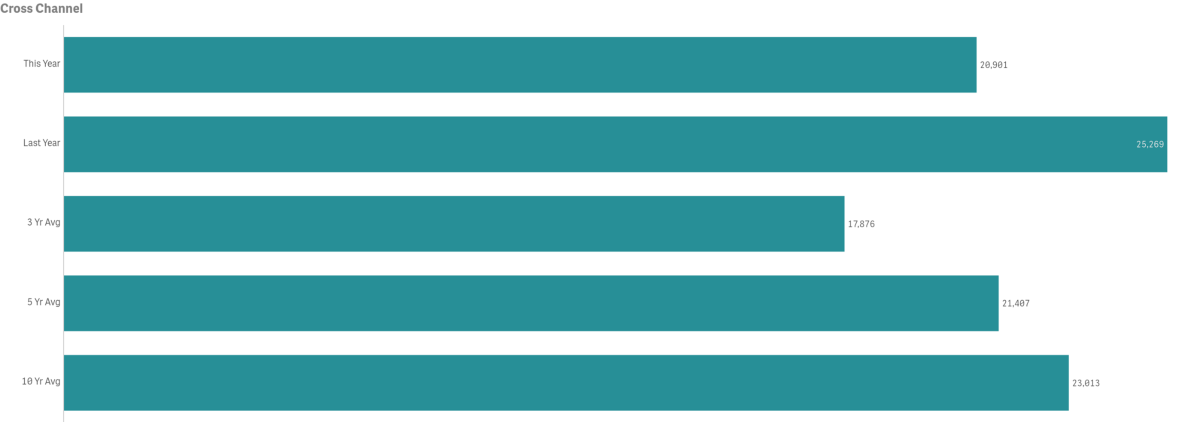
Cross Channel Passenger counts were down year-over-year by 17.1% or a decrease of 4,368 people
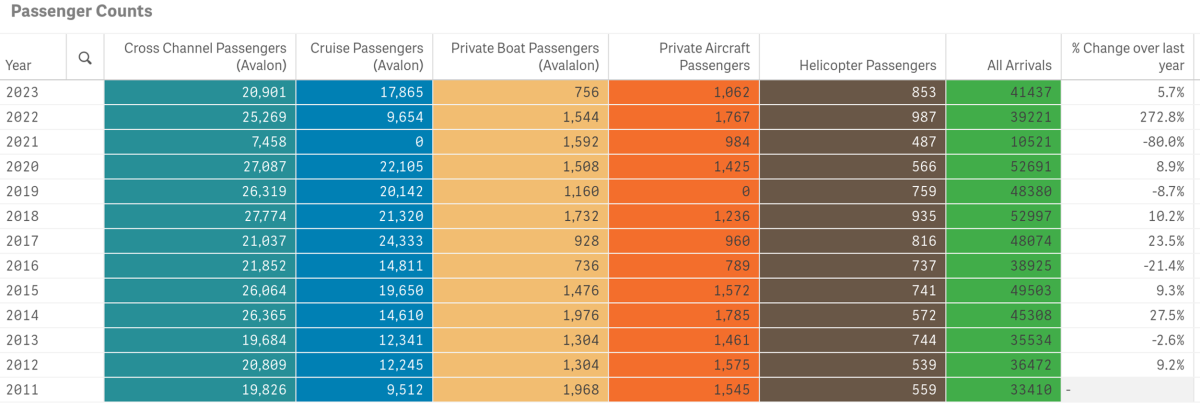
- 2018 had the highest volume for the month @ 27,774 passengers
- 2021 had the lowest volume for the month @ 7,758
- January Cross Channel Passenger counts were above the three-year average by 16.9% but below the five and ten-year averages by 22.4% and 9.2% respectively
- Cross Channel Passengers made up 50.44% of total monthly arrivals
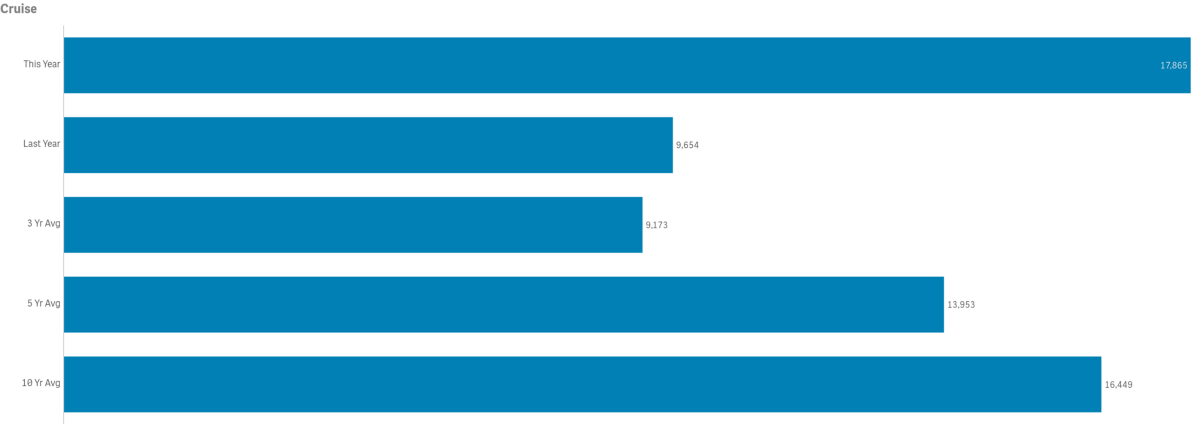
Cruise passenger counts totaled 17,865
- There were 9,654 cruise passengers in January 2022
- 2010 had the highest Cruise Passenger volume for the month @ 24,444
- 2021 had the lowest Cruise Passenger volume for the month @ 0. 1995 was next lowest at 1,038
- January Cruise Passenger counts were above the three, five and ten-year averages by 94.8%, 28% and 8.6% respectively.
Note multi-year averages are greatly impacted by the lack of cruise ships calling during COVID-19 suspension of operations
- Cruise Passengers made up 43.11% of total monthly arrivals
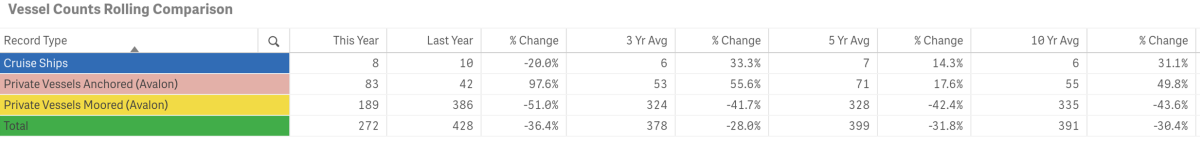
- The number of Cruise Ships calling on Avalon was 8
- 2017 had the highest number of ships calling @ 11
- 2021 had 0 ships call on us
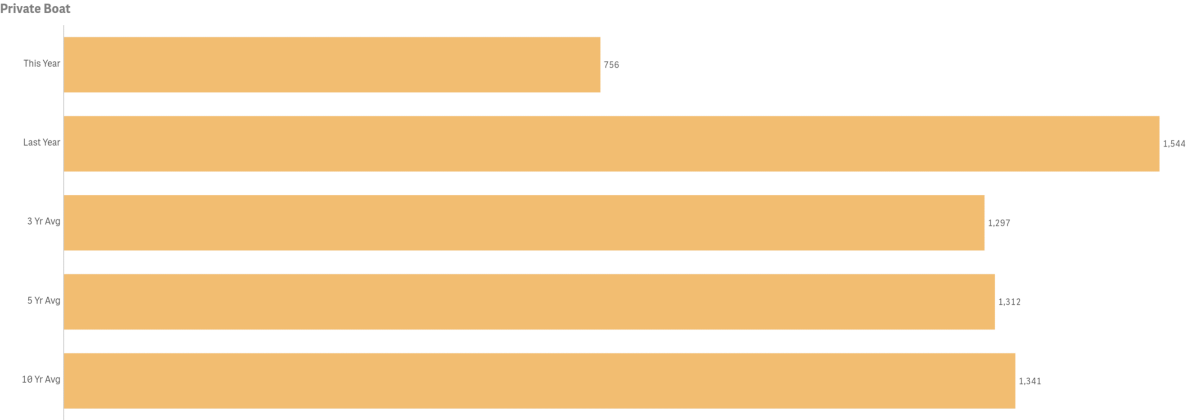
Private Boater Passenger counts totaled
- Private Boater Passenger counts were down from last year by 51% @ 756 vs 1,544
- 2014 had the highest passenger volume for the month @ 1,976
- 2016 had the lowest passenger volume month @ 736
- January Private Boater Passenger counts were below the three, five and ten-year averages by 41.7%, 42.4 and 43.6% respectively
- Private Boaters Made up 1.82% of total monthly arrivals
- January’s number of Vessels Anchored was up 97.6% @ 83 vs 42 last year
- 2019 had the highest number of Vessels Anchored @ 110
- 2012 had the lowest number of Vessels Anchored @ 13
- January was above the three, five and ten-year averages by 55.6%, 17.6% and 49.8% respectively
- January’s number of Vessels on Moorings was down 51% from last year @ 189 vs 386
- 2014 had the highest number of Vessels on Moorings @ 494
- 2016 had the lowest number of Vessels on Moorings @ 11
- January was below the three and five and ten-year averages for Vessels on Moorings by 41.7%, 42.4% and 43.6% respectively
Arrivals by Air
Combined in-bound air passenger counts for January totaled 1,929 down 31.1% from 2,801 in 2022 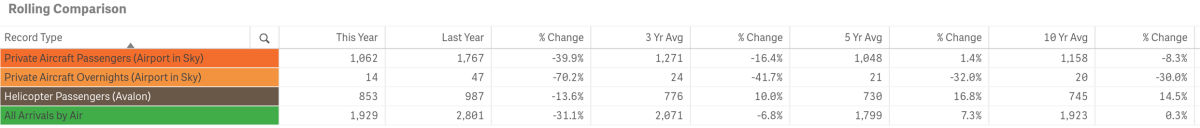
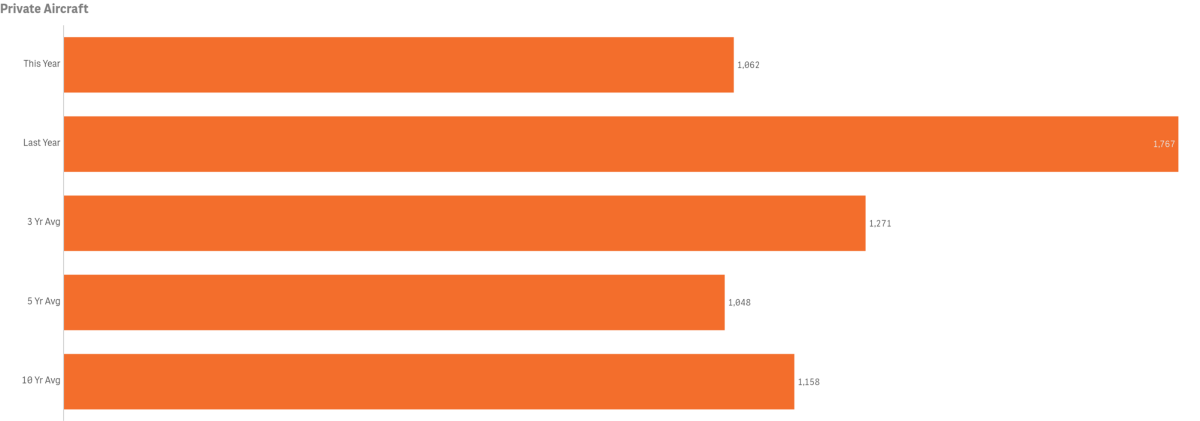
Private Aircraft Passengers (Airport in the Sky) were down 39.9% @ 1,062 vs 1,767 last year
- 2014 had the highest volume of Private Aircraft Passengers for the month @ 1,785
- 2019 had the lowest volume of Private Aircraft Passengers for the month @ 0
- January’s Private Aircraft Passenger count was below the three and ten-year averages by 16.4% and 8.3% respectively but above the five-year average by 1.4%
- January Private Aircraft Passengers made up 2.56% of total monthly arrivals
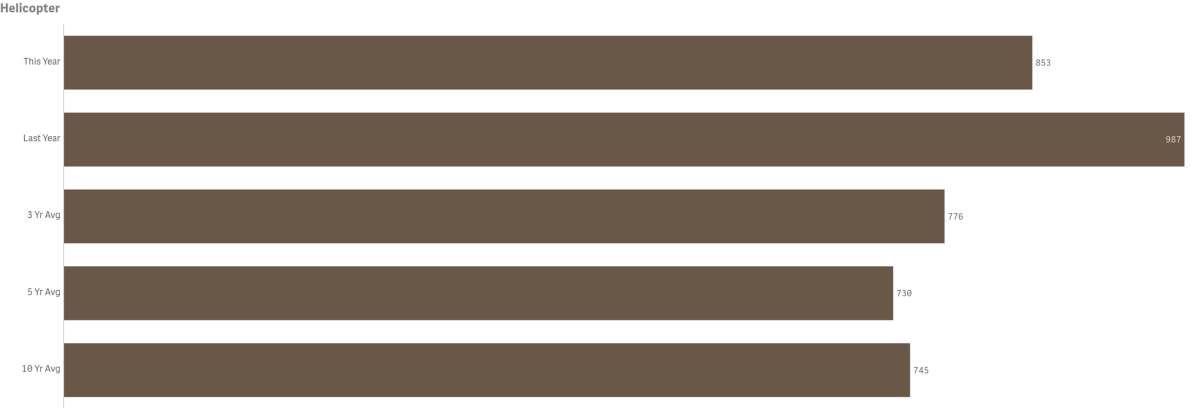
Helicopter Passenger counts were down year-over-year by 13.6% @ 853 vs. 987
- 2022 had the highest volume for the month @ 987
- 2012 the lowest volume for the month @ 539
- January Helicopter Passenger counts were above the three, five and ten-year average by 10%, 7.3% and .3% respectively
- January Helicopter Passengers made up 2.06% of total monthly arrivals
Lodging
Hotel and Short-Term Rental Occupancy from Smith Travel and AIRDNA

- Hotel Occupancy for January was up by 23% @ 53.4% vs. 43.2% in 2022
- Hotel Occupancy was above the three and five-year averages by 33.6% and 7.2% respectively, but below the ten-year average by 1.3%
- Short-Term Rental Occupancy for January was down 5.4% @ 35% vs 37% in 2022
- Short-term rental occupancy was below the three-year average by 2.1% but above the five and ten-year averages by 16.5% and 22.4% respectively
Competing Destination Occupancies
- Among our competitive set, Catalina ranked 8th in Hotel Occupancy and 10th in STR Occupancy for January 2023 (high to low)

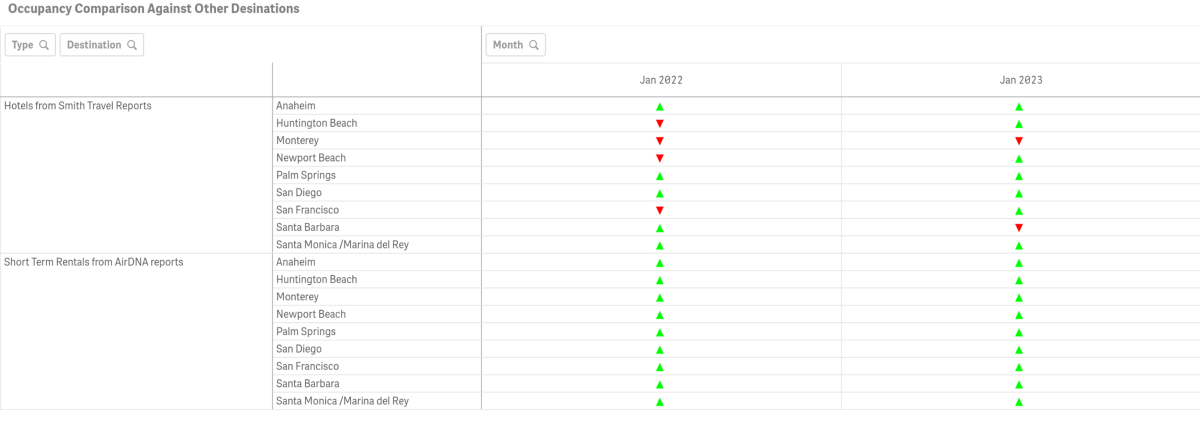
- January Hotel Occupancy was greater than Catalina’s in all but Monterey and San Francisco markets
- January Short-Term Rental Occupancy was greater than Catalina’s all competing markets
Hotel and Short-Term Rental Average Daily Rate from Smith Travel and AIRDNA

- Among our competitive set, Catalina ranked 5th in Average Daily Rate for Hotels and 5th in Average Daily Rate for STRs (high to low)
- January Hotel Average Daily Rate was up 30.2% @ $215.05 vs. $165.12 in 2022
- January Short-Term Rental Average Daily Rate was up down by 5.9% @ $502.00 vs. $539.00 in 2022
Hotel and Short-Term Rental Revenue Per Available Room from Smith Travel and AIRDNA

- Among our competitive set, Catalina ranked 9th for hotels and 10th for STRs in Revenue Per Available Room (high to low)
- January Hotel Revenue Per Available Room was up 61.1% @ $114.78 vs. $71.25 in 2022
- January Short-Term Rental Revenue Per Available Room was $198.00, down .5% from $197.00 in 2022
Visitors Services
Catalina Island Visitor Center

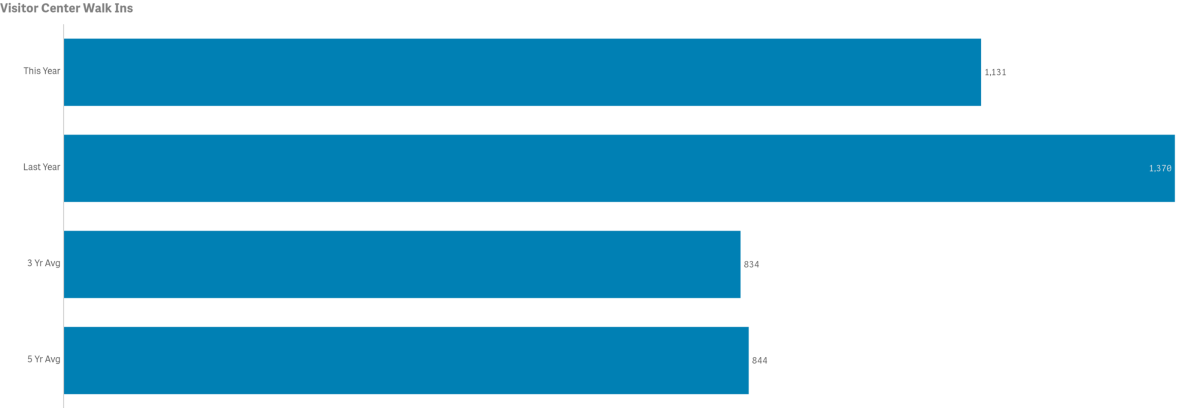
- Walk-ins for the month were down year-over-year by 17.4% @ 1,131 vs. 1,370 in 2022
- 2017 had the highest volume for the month @ 1,703
- 2021 had the lowest volume for the month @ 2
- January walk-in counts were above the three and five-year averages by 35.6% and 33.9% respectively
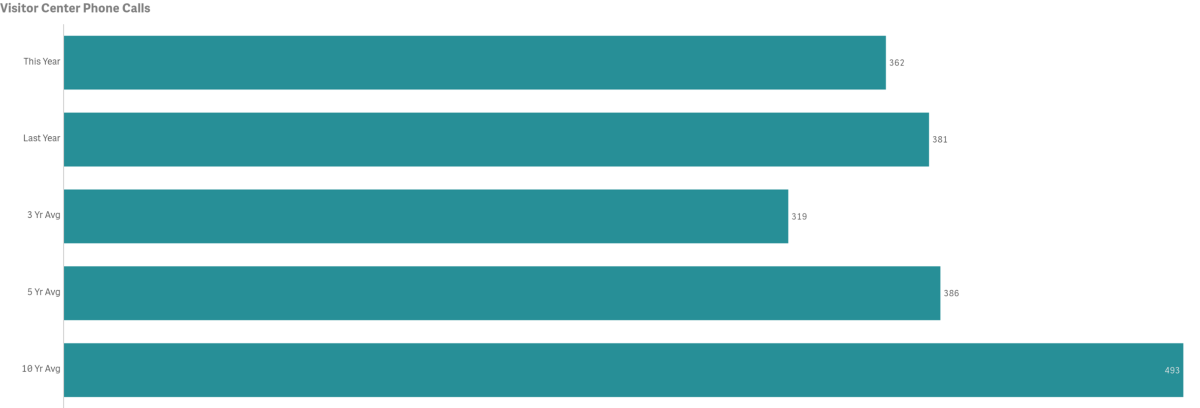
- The number of Phone Calls for the month was down by 5.0% year-over-year @ 362 vs 381in 2022
- 2012 had the highest volume of calls for the month @ 1,131
- 2021 had the lowest volume of calls for the month @ 214
- January calls were above the three-year average by 21.3% but below the five-year average by 7.4%
LoveCatalina.com
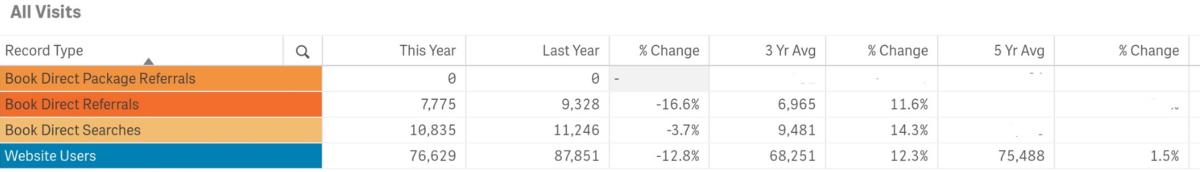
- January LoveCatalina.com total website users was down year-over-year by 12.8% @ 76,629 vs. 87,851 in 2022
- Monthly the number of website users was above the three and five-year averages by 12.3% and 1.5% respectively
- Book Direct referrals were down year-over-year by 16.6% @ 7,775 vs. 9,328 in 2022
- Book Direct lodging searches were down 3.7% @ 10,835 vs. 11,246 in 2022
- No Book Direct Packages were active for the month of January
Note changes to Book Direct in 2021 resulted in shifting traffic between referrals and searches
Visitor Guides & Newsletters
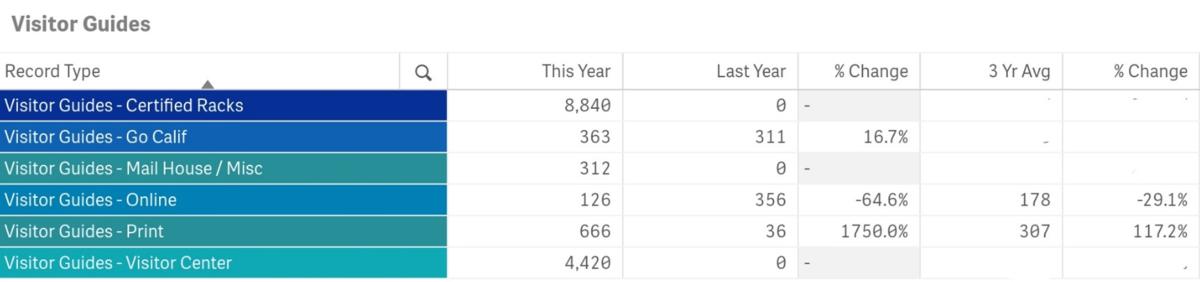
Note measures now include additional source tracking for months and years in which distributions were tracked.
- 8,840 Guides were delivered to Certified racks occurred this month
- Go California Print Guide orders totaled 363
- 312 Guides were delivered via Mail House for the month
- Online Guide downloads were down @ 126 vs. 356 in 2022
- Printed Visitor Guide orders on LoveCatalina.com @ 666, were up from 36 last year
- 4,420 Guides were delivered to the Visitor Center during the month
Note, no 2021 Guide was printed and 2022 guide distribution initiated in late February 2022.
Some distributors tracking is running behind and will be updated as received.
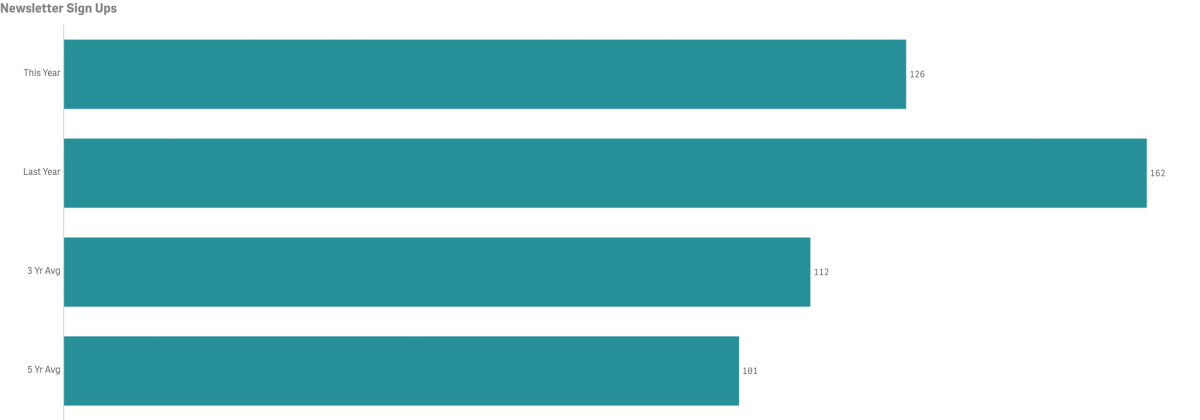
- New E-newsletter subscribers in January were down year-over-year @ 126 vs 162 in 2022
- New subscribers for the month were above the three and five-year averages of 112 and 101 respectively
Social Media
Cumulative totals by platform as of January below
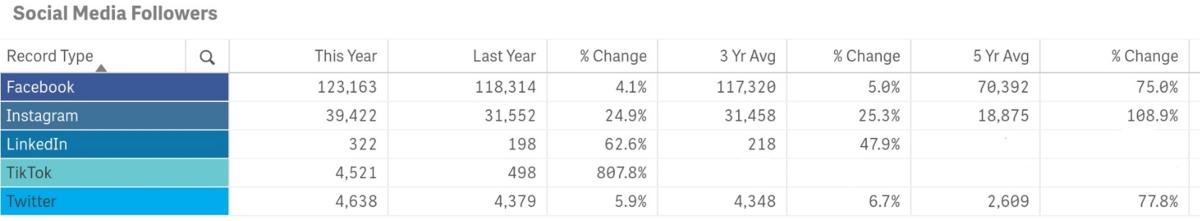
- Facebook followers are up year-over-year by 4.1%
- Instagram followers are up year-over-year by 24.9%
- Twitter followers are up year-over-year by 5.9%
- LinkedIn followers are up year-over-year by 62.6%
- TikTok is our newest platform and is up year-over-year by 807.8%.
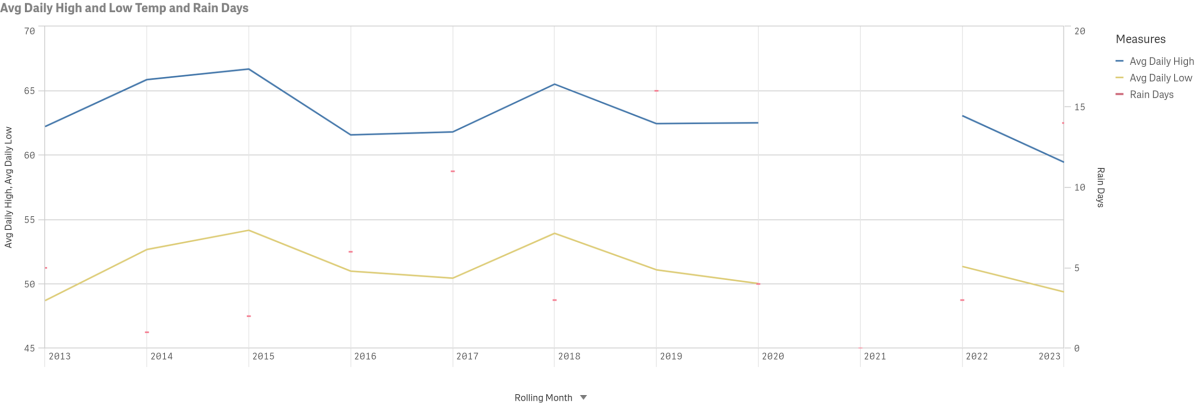
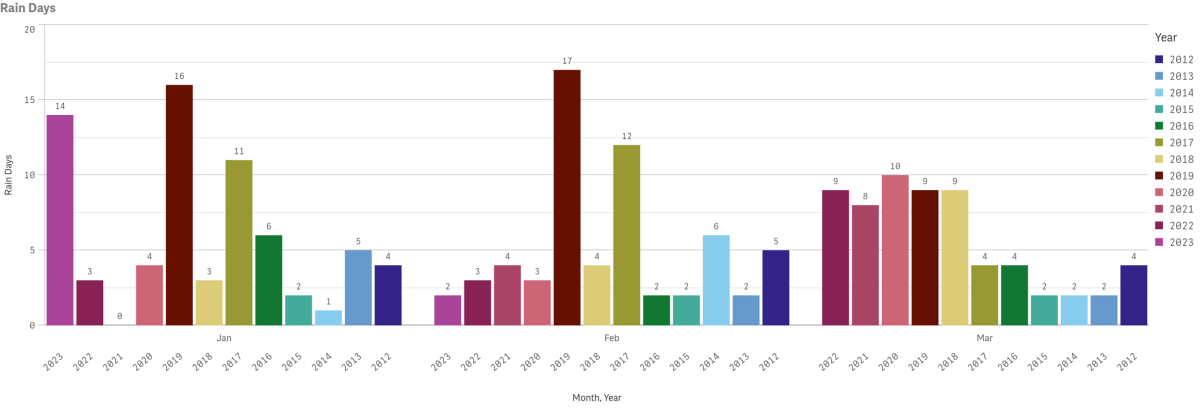
Weather
Data for January highs, lows and precipitation going back to 2012 is displayed below. Multi-year rain days data is also displayed by year and month since 2012. Measures are taken at Avalon Harbor. Some 2020 highs and lows did not report.