
April 2022 Visitor Stats
All Arrivals
April visitation increased year-over-year. Catalina saw in an overall increase by 40.6% or 25,954 visitors over the same month last year.
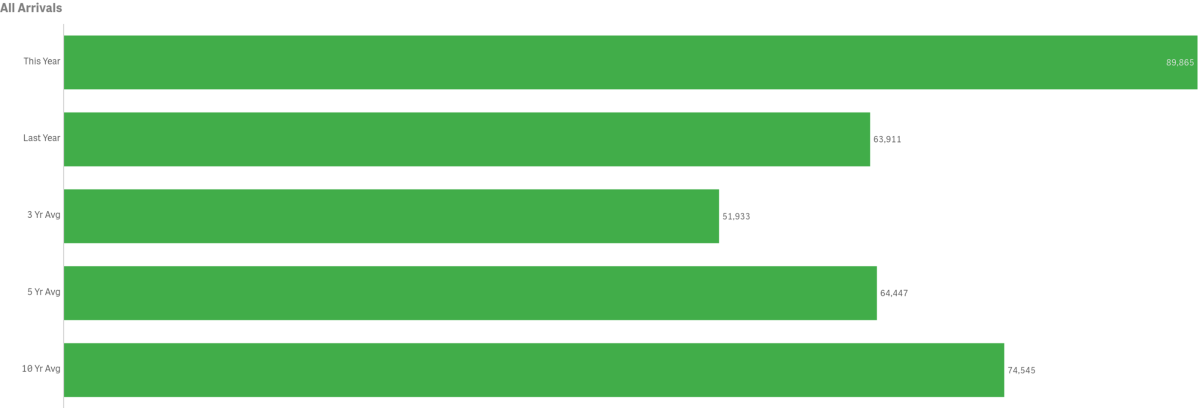
Previous tracking (below) for the month of April offers a comparison with and without COVID-19 impacts. April 2022’s total of 89,865 exceeded April 2019’s pre COVID-19 total arrivals of 85,372 by 4,493 visitors but is still below peaks seen in 2015 and 2017’s monthly totals.

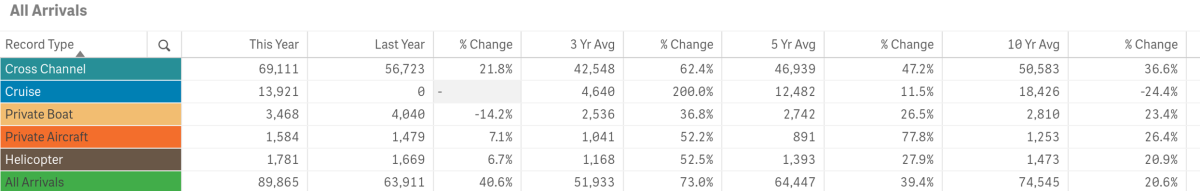
April’s total in-bound passenger count was above the three, five and ten-year averages of 51,933, 64,447 and 74,544 respectively.
Arrivals by Sea
Passengers arriving by sea, totaled 86,500 for the month and were up by 42.4% from last year.
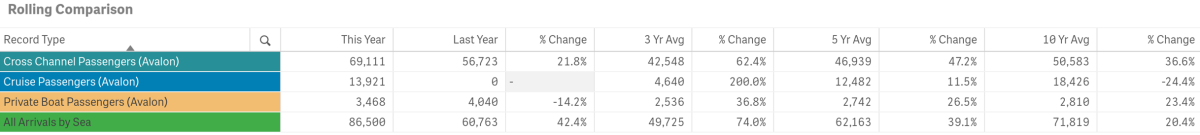
- April Cross Channel Passenger counts were up year-over-year by 21.8% or an increase of 12,388 people
- 2022 had the highest volume for the month @ 69,111 passengers
- 2020 had the lowest volume for the month @ 1,811. Pre COVID-19 impacts, the lowest year for the month was 2010 @ 36,100
- April Cross Channel Passenger counts were above the three, five and ten-year averages by 62.4%, 47.2% and 36.6% respectively
- Cross Channel Passengers made up 76.91% of total monthly arrivals

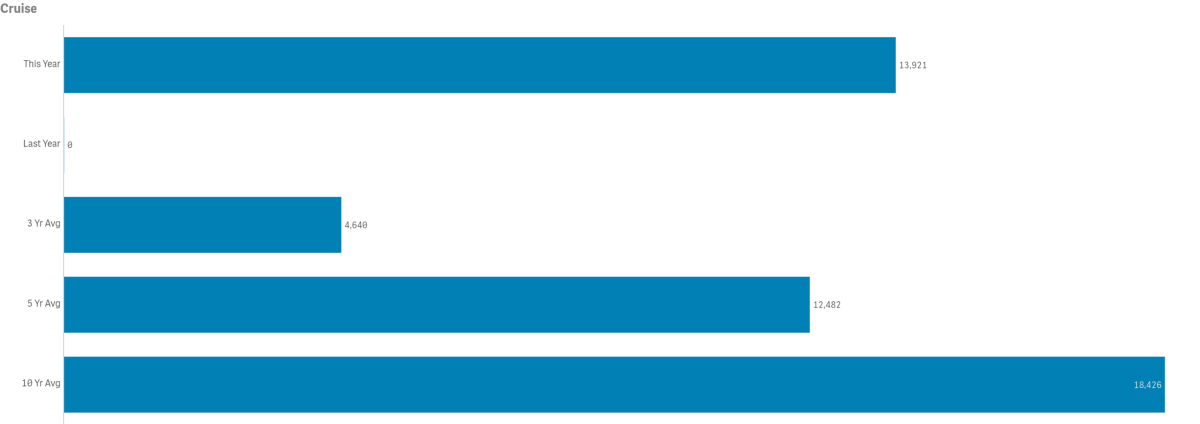
- Cruise passenger counts totaled 13,921
- There were no cruise passengers in April 2021
- 2014 had the highest Cruise Passenger volume for the month @ 30,495
- 2020 and 21 had the lowest Cruise Passenger volume for the month @ 0. Pre-COVID-19 the lowest count for the month was 1995 @ 6,497
- April Cruise Passenger counts were above the three and five-year averages by 200% and 11.5% respectively. Note with two years of few/no cruise ship calls, three and five-year data sets are greatly impacted. Cruise Passenger counts were below the ten-year average by 24.4%
- Cruise Passengers made up 15.49% of total monthly arrivals
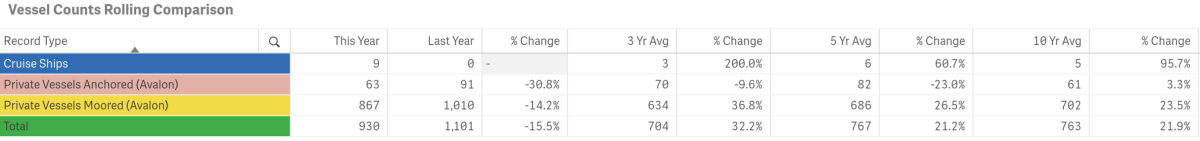
- The number of Cruise Ships calling on Avalon was 9
- 2019 had the greatest number of ships @ 10
- 2020 and 21 had the lowest number of ships @ 0
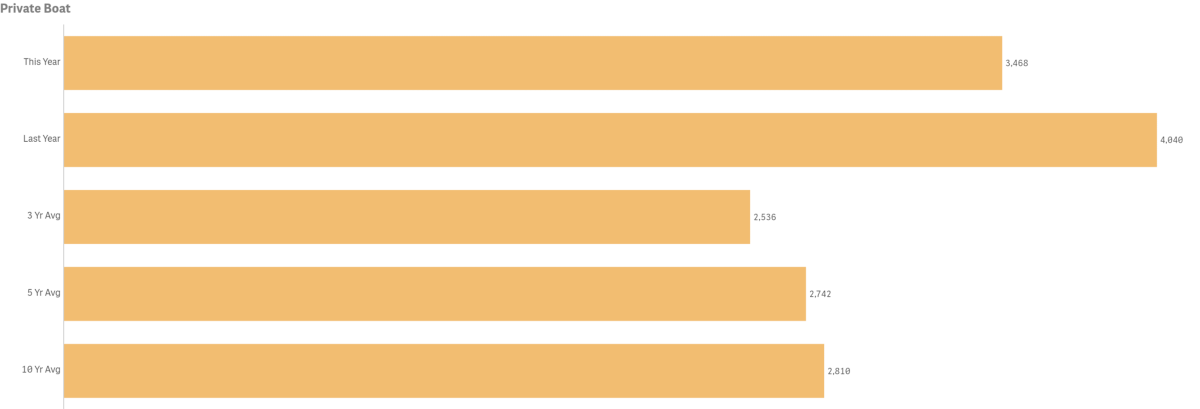
- Private Boater Passenger counts were down from last year @ 2,340 vs. 2,512
- 2021 had the highest passenger volume for the month @ 4,040
- 2020 had the lowest passenger volume month @ 100. Pre-COVID-19, the lowest for the month was 2,396 in 2012
- April Private Boater Passenger counts were below the three-year average by 14.2% but above the five and ten-year averages by 26.5% and 23.4% respectively
- April’s number of Vessels Anchored was down @ 63 vs 91 last year
- 2019 had the highest number of Vessels Anchored @ 94
- 2013 had the lowest number of Vessels Anchored @ 3
- April was below the average number of Vessels Anchored for three, five and ten-year averages by 9.6%, 23% and 3.3% respectively
- April’s number of Vessels on Moorings was down from last year @ 867 vs. 1,000
- 2021 had the highest number of Vessels on Moorings @ 1,010
- 2020 had the lowest number of Vessels on Moorings @ 25. Pre COVID-19, the lowest was 2012 @ 599
- April was above the three, five and ten-year averages for Vessels on Moorings by 32.2%, 21.2% and 21. 3% respectively
- Private Boaters Made up 2.6% of total monthly arrivals
Arrivals by Air
Combined in-bound air passenger counts for April totaled 3,424 up from 3,188 in 2021. 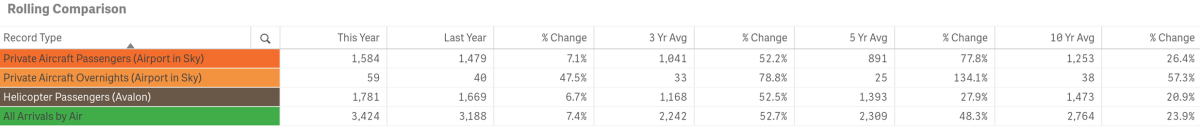
- Private Aircraft Passengers (Airport in the Sky) were up 7.1% @ 1,584 vs 1,479 last year
- 2015 had the highest volume of Private Aircraft Passengers for the month @ 1,842
- 2020 had the lowest volume of Private Aircraft Passengers for the month @ 60 due to COVID-19 impacts
- 2019 had the next lowest @ 96, due to runway repairs
- April counts for Private Aircraft Passengers was above the three, five and ten-year averages by 52.2%, 77.8% and 26.4% respectively
- April Private Aircraft Passengers made up 1.76% of total monthly arrivals
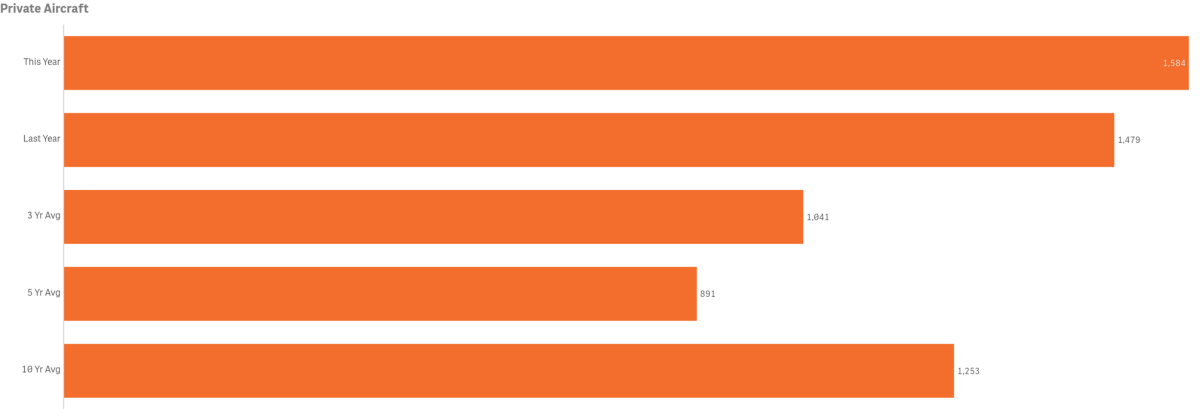
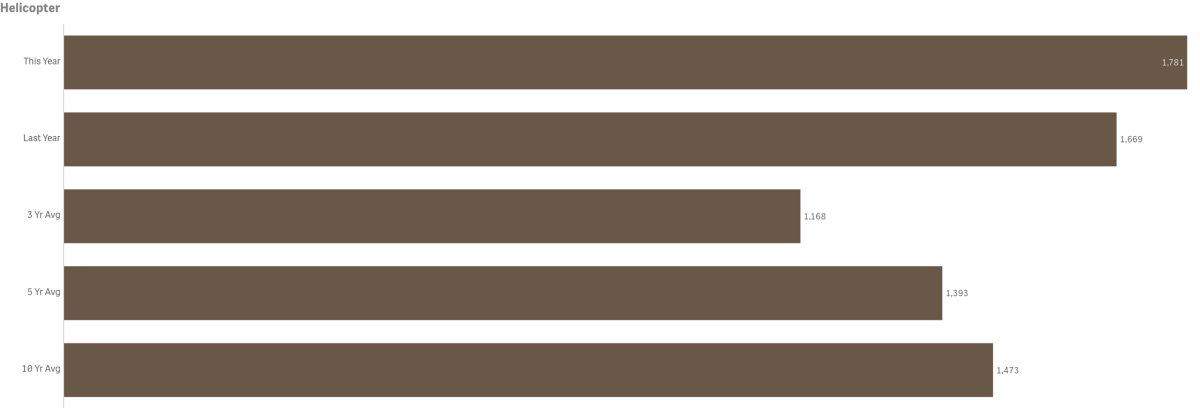
- Helicopter Passenger counts were up 6.7% year-over-year @ 1,781 vs. 1,669
- 2015 had the highest volume for the month @ 1,888
- 2020 the lowest volume for the month @ 53. Pre COVID-19 the lowest for the month was 2012 @ 1,036
- April Helicopter Passengers counts were above the three, five and ten-year averages by 52.7%, 48.3% and 23.9% respectively
- April counts for Helicopter Passengers made up 1.98% of total monthly arrivals
Lodging
Hotel and Short-Term Rental Occupancy from Smith Travel and AIRDNA

- Hotel Occupancy for April was 76.6%. Data was not reported in 2021
- Hotel Occupancy was below the five and ten-year averages by 4.3% and 5.1% respectively
- Short-Term Rental Occupancy for April was 66% vs 49.4% in 2021
- Short-term rental occupancy was above the three, five and ten-year averages by 16.8%, 40.5% and 31.3% respectively
Competing Destination Occupancies

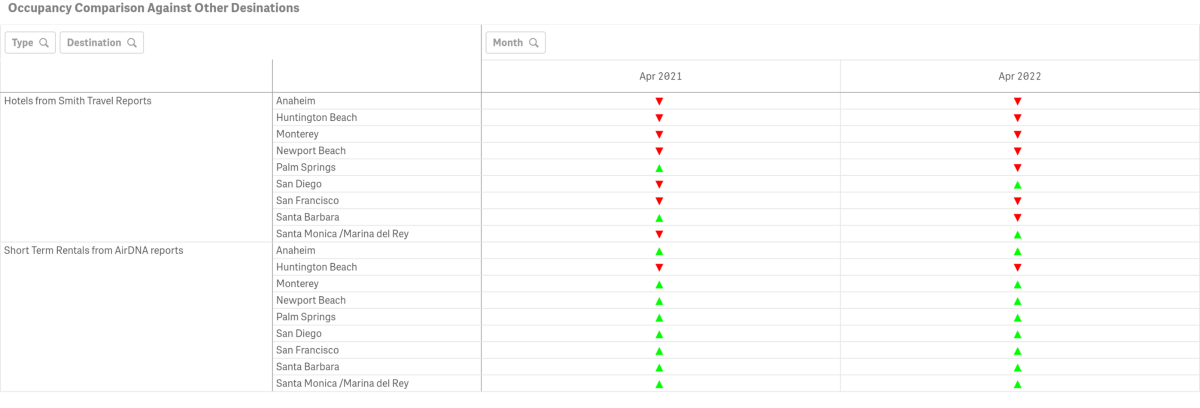
- April Hotel Occupancy was greater than Catalina’s in San Diego and Santa Monica
- April Short-Term Rental Occupancy was greater than Catalina’s in all competing destinations except Huntington Beach
Hotel and Short-Term Rental Average Daily Rate from Smith Travel and AIRDNA
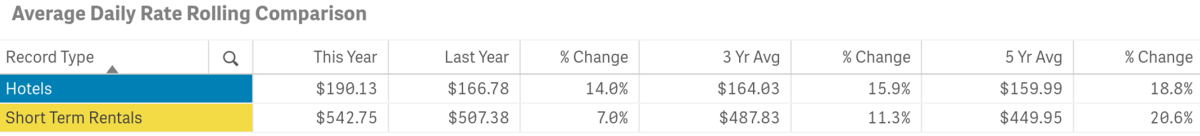
- April Hotel Average Daily Rate was $190.13 vs $166.78 in 2021
- April Short-Term Rental Average Daily Rate was $542, up from $507.38 in 2021
Hotel and Short-Term Rental Revenue Per Available Room from Smith Travel and AIRDNA
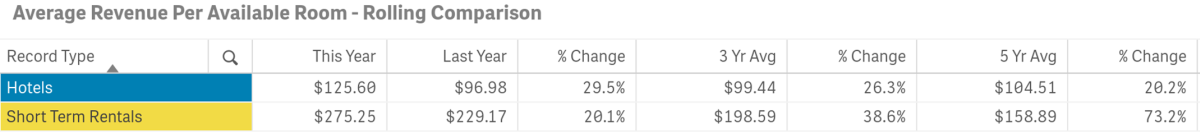
- April Hotel Revenue Per Available Room was $125.60 vs $96.98 in 2021
- April Short-Term Rental Revenue Per Available Room was $275.75 up from $229.17 in 2021
Visitors Services
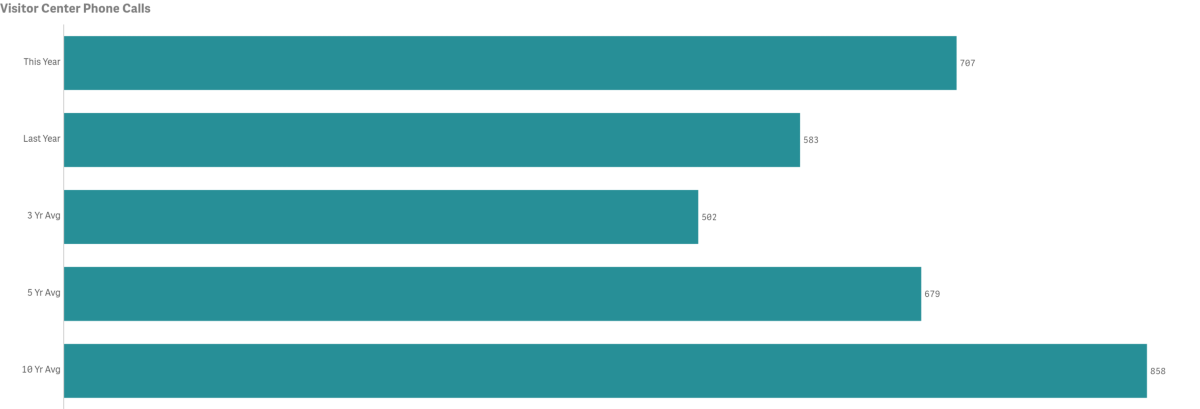
Catalina Island Visitor Center

- Number of Phone Calls for the month was up year-over-year by 21.3% @ 707 vs. 583
- 2007 had the highest volume for the month @ 1,693 calls
- 2020 had the lowest volume for the month @ 217 calls. Pre-COVID-19 lowest call volume was 2013 @ 751
- April call counts were above the three-year average by 40.7% and the five-year average by 4.1% but below the ten-year average by 17.6%
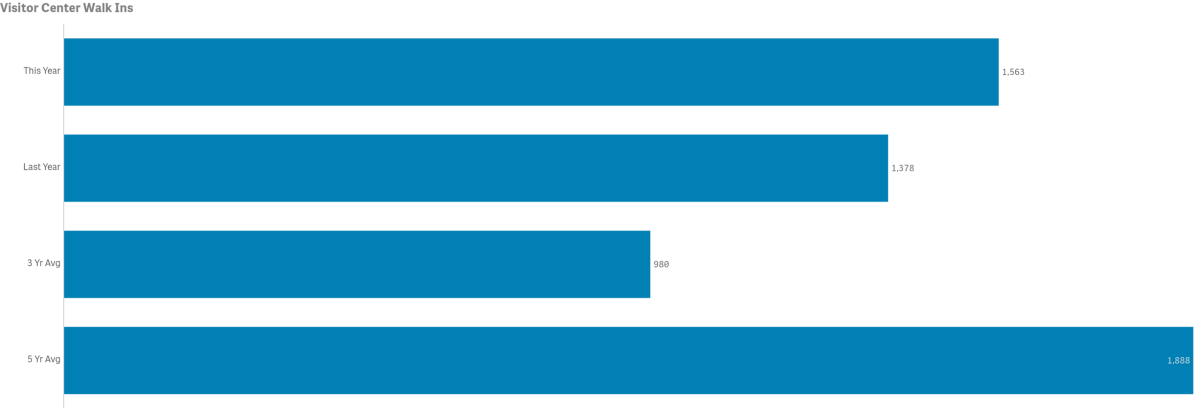
- The number of Walk-Ins for the month was up by 13.4% year-over-year @ 1,563 vs 1,378
- 2018 had the highest volume of Walk-ins for the month @ 3,443 guests
- 2020 had the lowest volume of Walk-ins for the month @ 0 guests. Pre COVID-19 lowest volume of guests was 2017 @ 2,935
- April Walk-In counts were above the three-year average of 980 but below the five-year average of 1,888
LoveCatalina.com
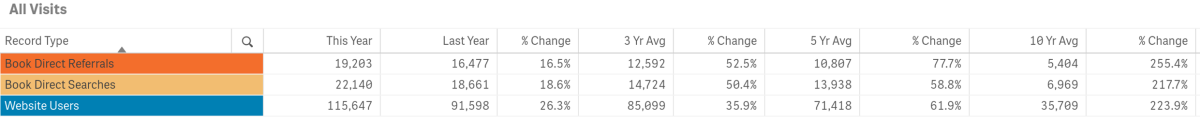
- April LoveCatalina.com website user numbers were up year-over-year by 26.3% @ 115,647 vs. 91,598 in 2021
- Website users were above the three, five and ten-year averages by 35.9%, 61.9% and 223.9% respectively
- Book Direct referrals were up year-over-year by 16.5% @ 19,203 vs. 16,477 in 2021
- Note changes to Book Direct on member links has resulted in shifting traffic to referrals vs. searches. Despite that, Book Direct lodging searches were down up 18.6% @ 22,140 vs. 18,661 in 2021 and were still higher than both three and five-year averages.
Visitor Guides & Newsletters
- Note measures now include Certified racks, Go California and Trade Show giveaways in months for which distributions occurred.
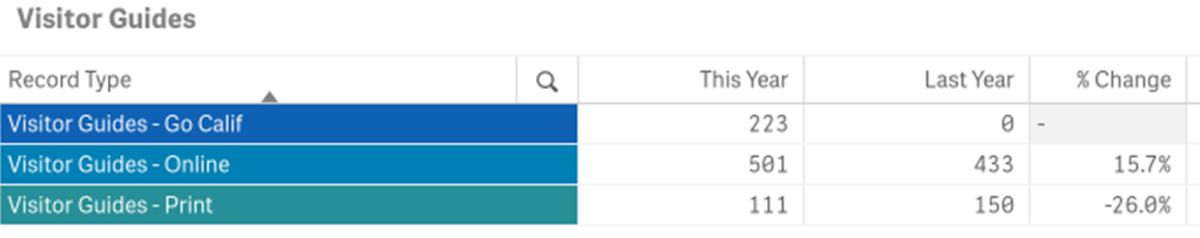
- Printed Visitor Guide orders @ LoveCatalina.com @ 111, down from 150 last year
- No 2021 Guide was printed and 2022 guides distribution initiated in late February
- Online Guide downloads were up by 15.7% @ 501 vs. 433 in 2021
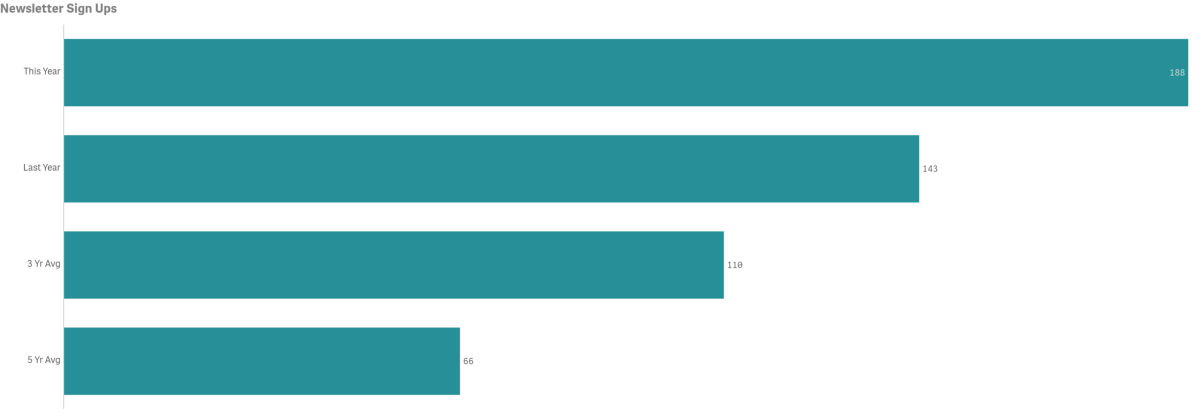
- New E-blast newsletter subscribers in April were up year-over-year @ 188 vs 143 in 2021
- New subscribers exceeded three and five-year averages
Social Media
Cumulative totals by platform as of April below.

- Facebook followers are up year-over-year by 5.9%
- Instagram followers are up year-over-year by 22.7%
- Twitter followers are up year-over-year by 9.0%
- LinkedIn followers are up year-over-year by 80.3%
- TikTok is our newest platform and is up year-over year by 3,725%.
Year-to-Date Measures
Total year-to-date arrivals are up from last year by 82.9%
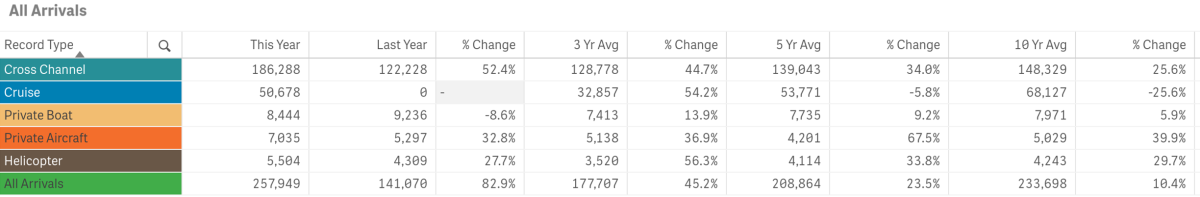
- Year-to-date Total Arrivals were up @ 257,949 vs. 141,870 last year or a difference of 116,079 visitors
- The total arrivals year-to-date exceeded the three-year average of 177,707 by 45.2%, five-year average by 23.5% and ten-year average by 10.4%
- All arrival sectors are up year-to-date with the exception of Private Boat
Year-to-Date—Historical Arrivals
COVID-19 and pre-Covid-19 comparison data is illustrated in the ten-year snapshot below (January - April combined).
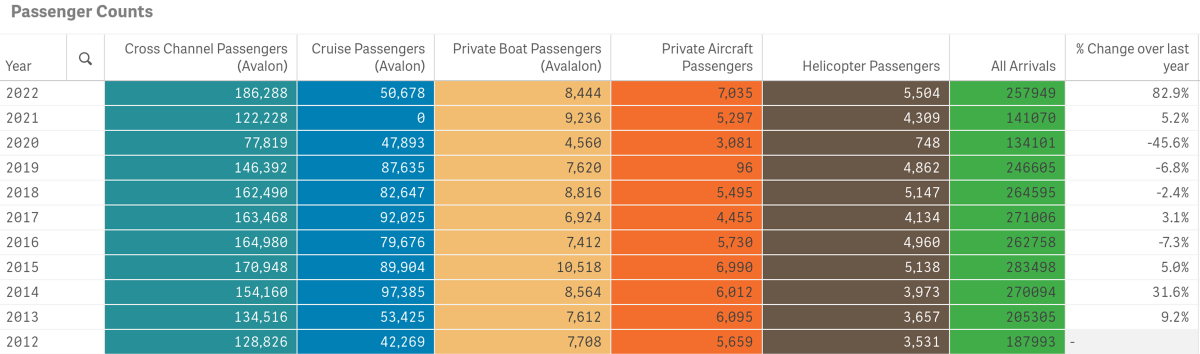
- 2015 had the highest total visitation year-to-date @ 283,498
- 2020 had the lowest year-to-date total visitation @ 134,101
- 2012 had the lowest pre COVID-19 year-to-date @ 187,993
To view historical data for total arrivals by sector, year and month in a spreadsheet form click here. PDF File.
Year-to-date Lodging
Hotel and Short-Term Rental Occupancy from Smith Travel and AIRDNA

- Hotel Occupancy YTD is 65.1% vs. 51.7% tracked for the same time period in 2021
- Short-Term Rental Occupancy Year-To-Date is 50.2%, up from 44.5% in 2021
- According to Smith Travel, YTD Catalina’s Hotel Occupancy was above San Francisco and Monterey and Newport Beach. Competing destinations of Palm Springs, Santa Barbara, San Diego, Huntington Beach, Anaheim and Santa Monica exceeded our year-to-date hotel occupancy.
- According to AirDNA, Catalina’s YTD Short-Term Rental Occupancy was below all destinations in our competitive set except Palm Springs
Year-to-date Visitor Services
Catalina Island Visitor Center

- Number of Phone Calls year-to-date are up by 62.1% @ 2,223 vs. 1,371
- Year-to-date Phone Calls exceeded the three-year average, were nearly on par with five-year but remained below the ten-year average
- Number of Walk-Ins year-to-date are up @ 6,112 vs. 2,555 or 139.2%
- Year-to-date Walk-In counts were above the three, five and ten-year averages
Year-to-date LoveCatalina.com
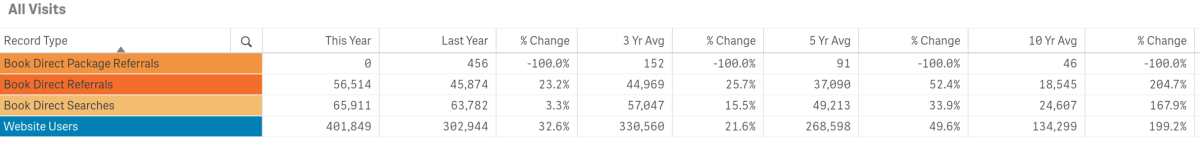
- LoveCatalina.com website users are up year-to-date by 32.6% @ 401,849 vs. 302,944 in 2021
- Book Direct lodging searches are up year-to-date by 3.3% @, 65,911 vs. 63,782 in 2021. Note changes to Book Direct on member links has resulted in shifting traffic to referrals vs. searches
- Book Direct referrals year-to-date are up by 23.2% @ 56,514 vs. 45,874 in 2021
- Book Direct Package referrals are not currently active on our site
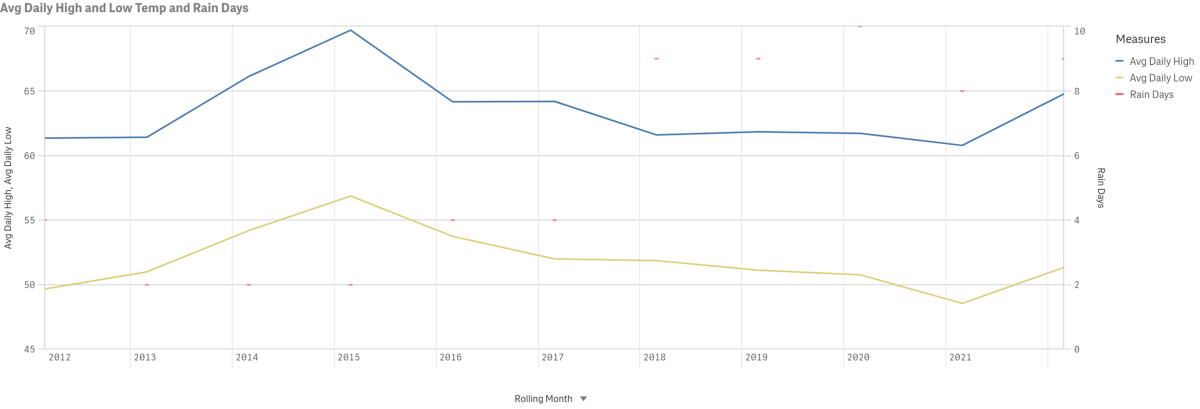
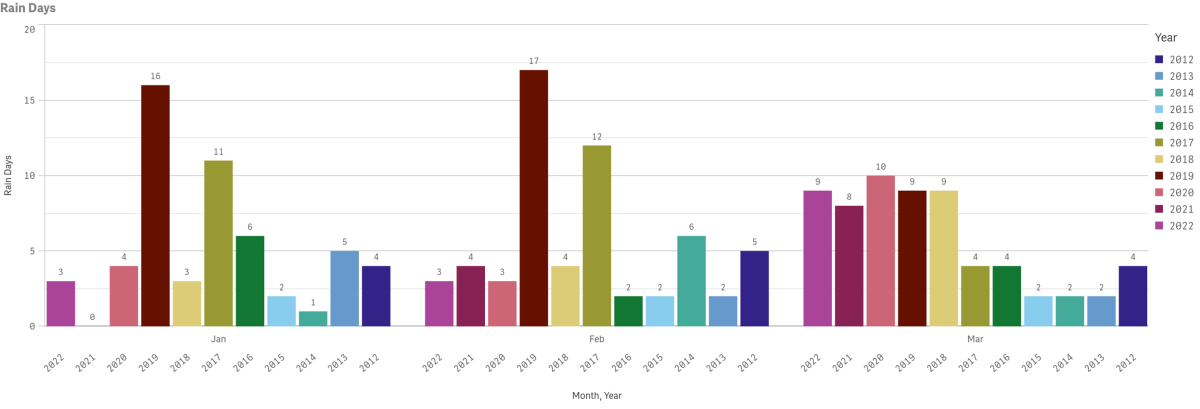
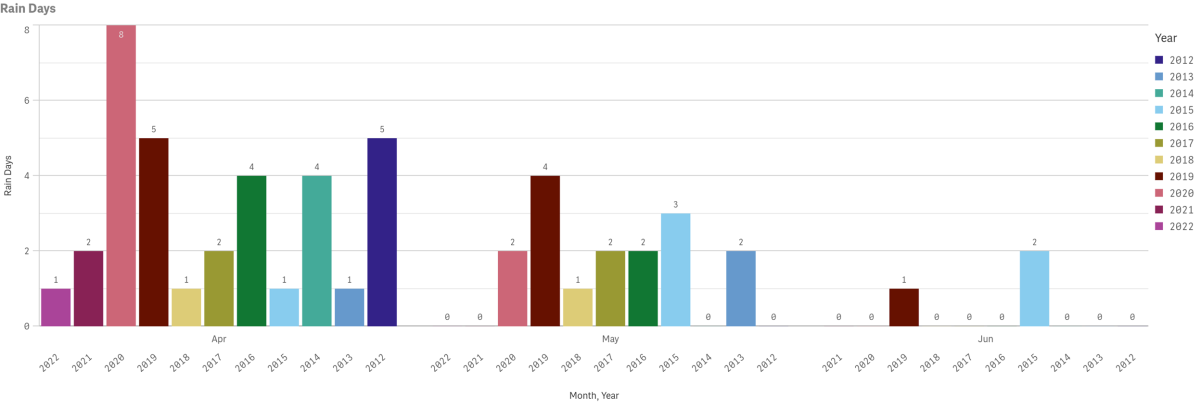
Weather
Data for April highs, lows and precipitation going back to 2012 is displayed below. Multi-year rain days data is also displayed by year and month since 2012. Measures are taken at Avalon Harbor.


Catalina Flyer from Newport
$10 Off Catalina Island Ferry
Hop onboard the Catalina Flyer for daily ferry service from Newport Beach to Avalon, Catalina Island in just over 1 hour.

Catalina Sea Spa
Recharge with massages starting at $110.
Discover Bliss at Catalina Sea Spa! Book online or call 310-510-8920. Treat yourself and escape to relaxation today!

