
March 2023
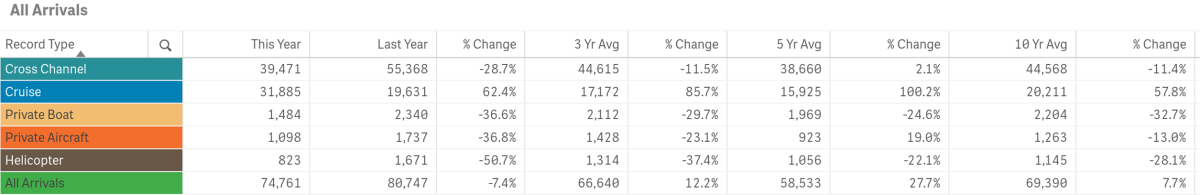
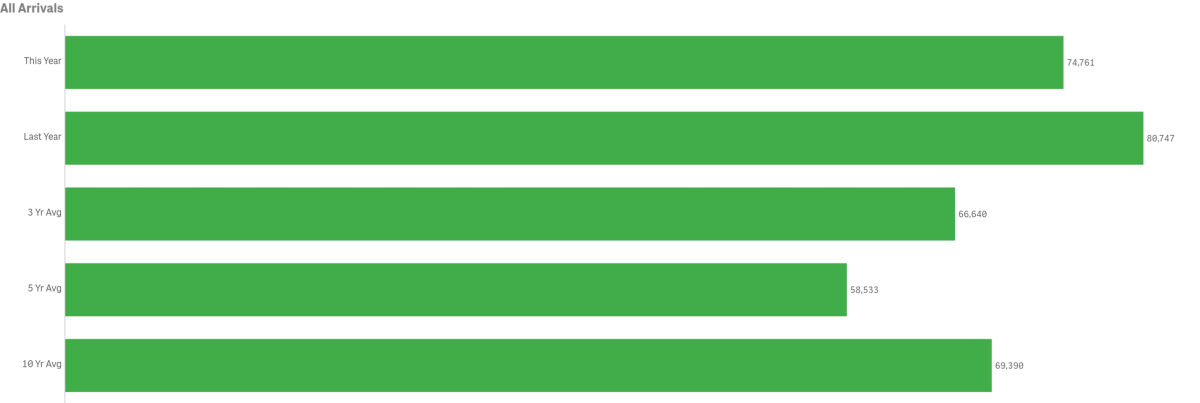
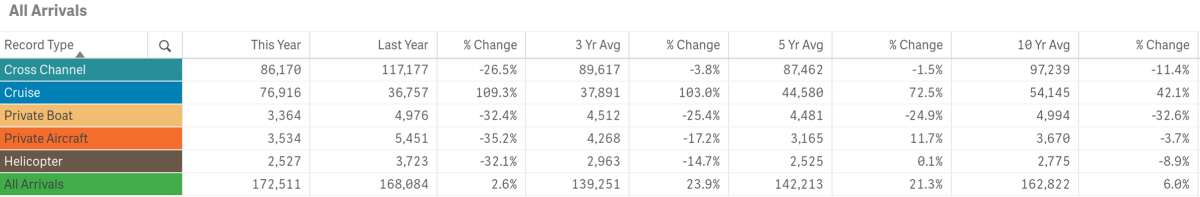
All Arrivals
March visitation decreased year-over-year by 7.4% or 5,986 visitors
Previous tracking (below) for the month of March offers a comparison with and without COVID-19 impacts. March 2023 was below the peak visitation for the month recorded in 2015 of 83,894 by 9,133 travelers.
March’s total in-bound passenger count was above the three, five and ten-year averages for the month
Arrivals by Sea
Passengers arriving by sea, totaled 72,840 for the month, a decrease of 5.8% from last year.
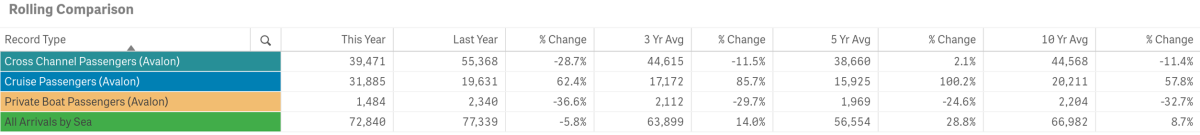
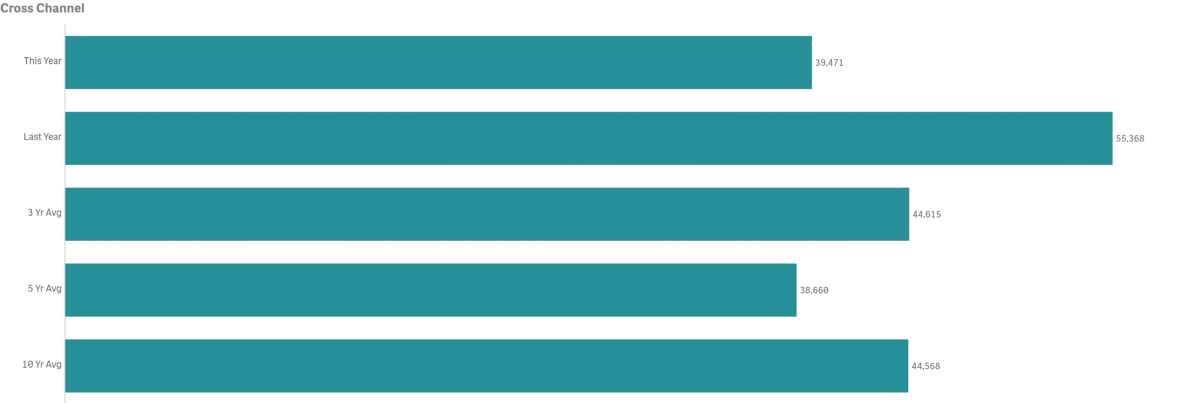
Cross Channel Passenger counts were down year-over-year by 28.7% or a decrease of 15,897 people
- 2022 had the highest volume for the month @ 55,368 passengers
- 2020 had the lowest volume for the month @ 15,339
- March Cross Channel Passenger counts were below the three and ten-year averages by 11.5% and 11.4% respectively, but above the five-year average by 2.1%
- Cross Channel Passengers made up 52.78% of total monthly arrivals
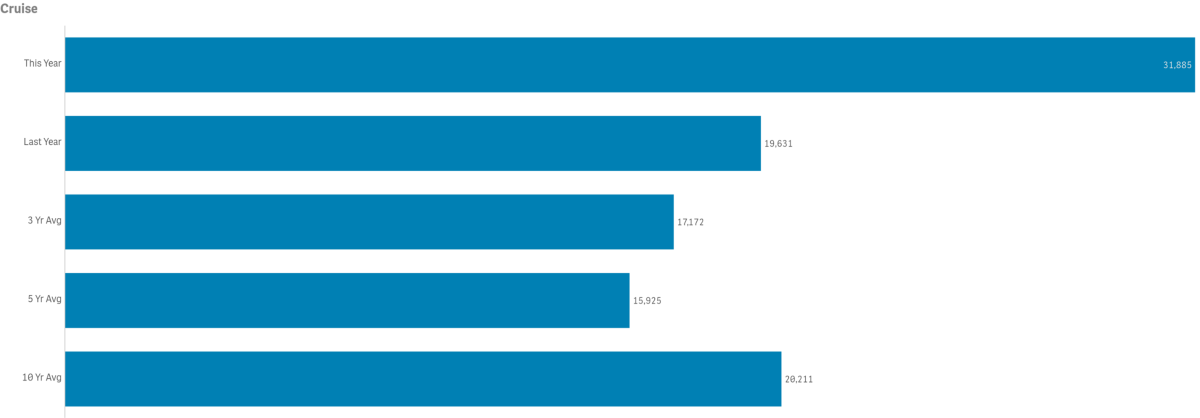
Cruise passenger counts totaled 31,885, up by 62.4% from 2022 or 12,254 visitors
- 2014 had the highest Cruise Passenger volume for the month @ 32,738
- 2021 had the lowest Cruise Passenger volume for the month @ 0.
- March Cruise Passenger counts were above the three, five and ten-year averages by 85.7%, 100.2% and 57.8% respectively. Note multi-year averages are greatly impacted by the lack of cruise ships calling during COVID-19’s suspension of operations
- Cruise Passengers made up 42.65% of total monthly arrivals
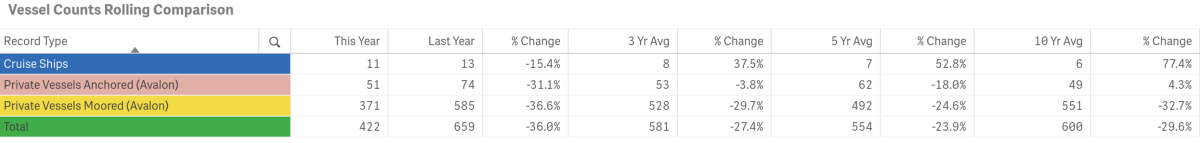
- The number of Cruise Ships calling on Avalon was 11
- 2022 had the highest number of ships calling @ 13
- 2021 had 0 ships call on us
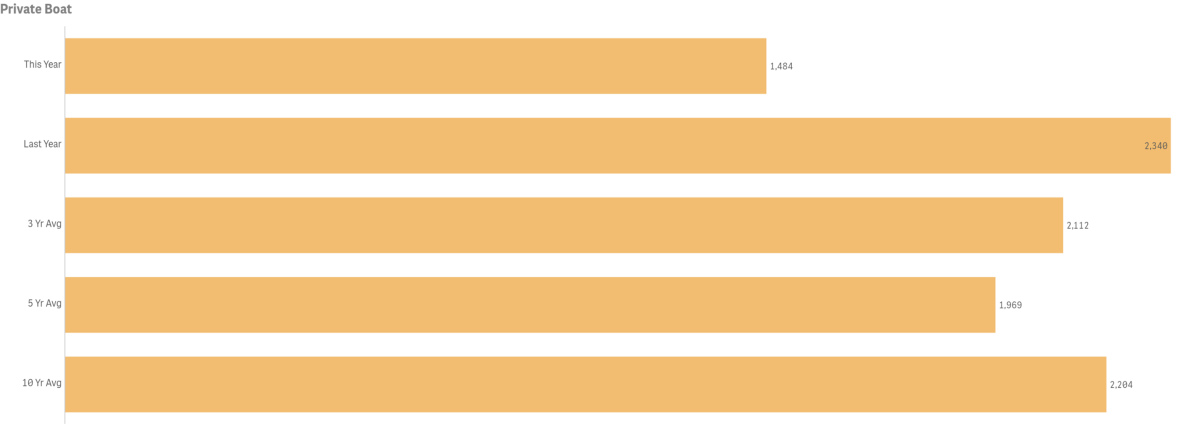
Private Boater Passenger counts totaled 1,484, down from last year by 36.6% or 865 visitors
- 2015 had the highest passenger volume for the month @ 3,384
- 2023 had the lowest passenger volume month @ 1,484
- March Private Boater Passenger counts were below the three, five and ten-year averages by 29.7%, 24.6% and 32.7% respectively
- Private Boaters Made up 1.98% of total monthly arrivals
- March’s number of Vessels Anchored was down by 31.1% @ 51 vs 74 last year
- 2019 had the highest number of Vessels Anchored @ 110
- 2012 had the lowest number of Vessels Anchored @ 3
- March was below the three and five-year averages by 3.8% and 18% respectively, but above the ten-year average by 4.3%
- March’s number of Vessels on Moorings was down 36.5% from last year @ 371 vs 585
- 2021 had the highest number of Vessels on Moorings @ 628
- 2020 had the lowest number of Vessels on Moorings @ 238
- March was below the three, five and ten-year averages by 29.7%, 24.6% and 32.7% respectively
Arrivals by Air
Combined in-bound air passenger counts for March totaled 1,950 down 43.7% from 3,463 in 2022 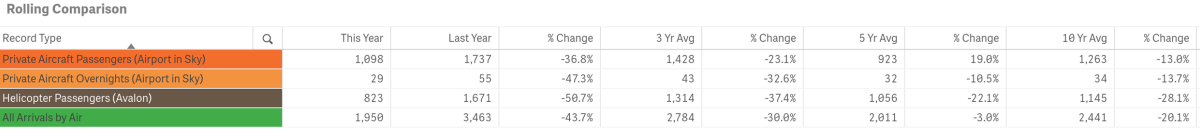
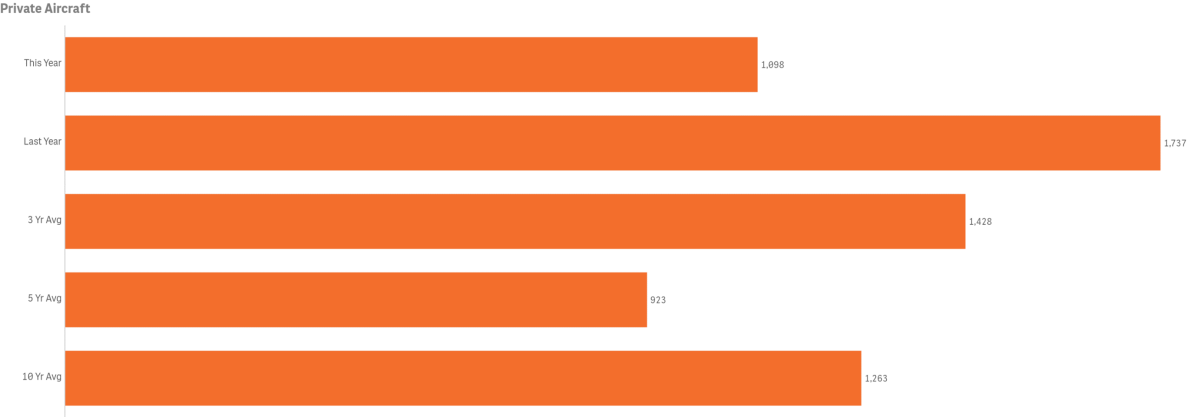
Private Aircraft Passengers (Airport in the Sky) were down 36.8% @ 1,098 vs 1,737 last year
- 2015 had the highest volume of Private Aircraft Passengers for the month @ 2,175
- 2019 had the lowest volume of Private Aircraft Passengers for the month @ 0
- March’s Private Aircraft Passenger count was below the three and ten-year averages by 23.1% and 13% respectively but above the five -year average by 19.0%
- March’s Private Aircraft Passengers made up 1.47% of total monthly arrivals
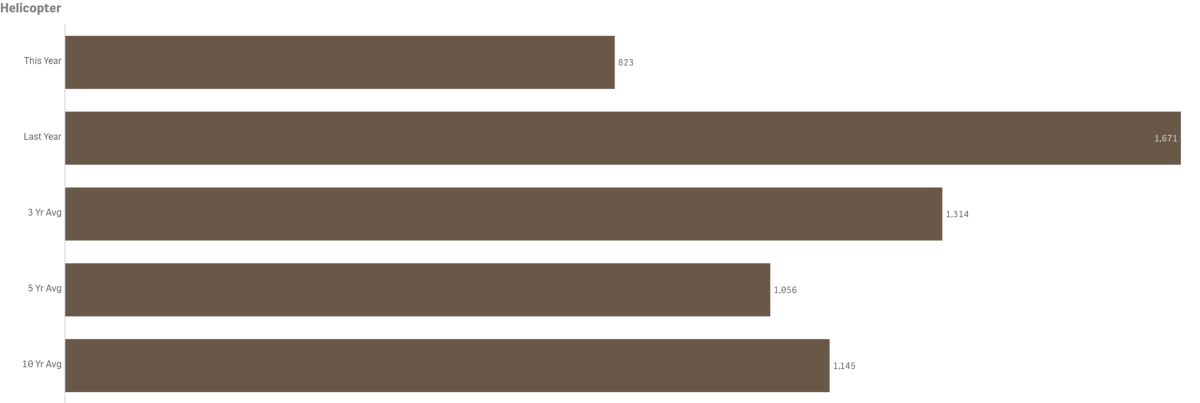
Helicopter Passenger counts were down year-over-year by 50.7% @ 823 vs. 1,671
- 2022 had the highest volume for the month @ 1,671
- 2020 the lowest volume for the month @ 238
- March Helicopter Passenger counts were below the three, five and ten-year averages by 37.4%, 22.1% and 28.1% respectively
- March Helicopter Passengers made up 1.1% of total monthly arrivals
Lodging
Hotel and Short-Term Rental Occupancy from Smith Travel and AIRDNA

- Hotel Occupancy for March was down by 4.6% @ 62.7% vs. 65.7% in 2022
- Hotel Occupancy was above the three, five and ten-year averages by 2.7%, 8.9% and 2% respectively
- Short-Term Rental Occupancy for March was down 12.5% @ 49% vs 56% in 2022
- Short-term rental occupancy was below the three-year average by 6.6% but above the five and ten-year averages by 18.1% and 24.9% respectively
Competing Destination Occupancies
- Among our competitive set, Catalina ranked 9th in Hotel Occupancy and 10th in STR Occupancy for March 2023 (high to low)

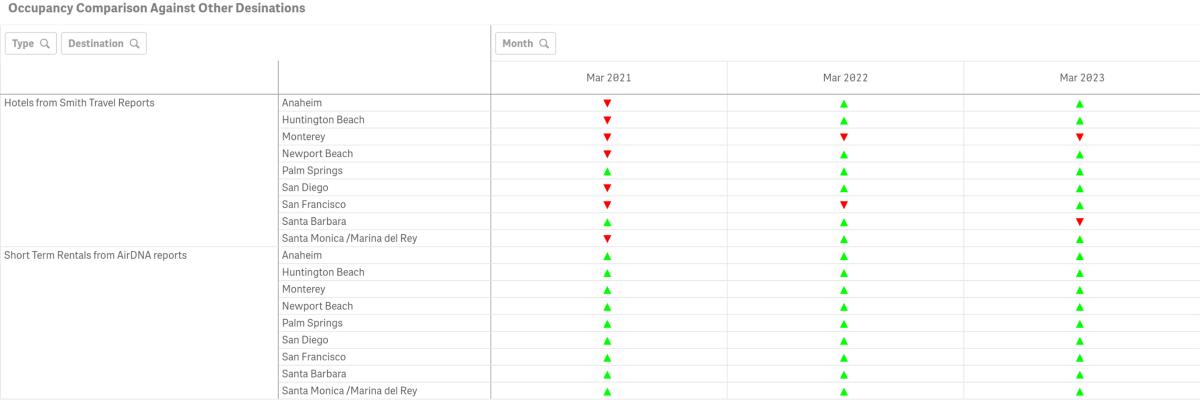
- March Hotel Occupancy was greater than Catalina’s in all but Monterey and Santa Barbara
- March Short-Term Rental Occupancy was greater than Catalina’s all competing destinations
Hotel and Short-Term Rental Average Daily Rate from Smith Travel and AIRDNA

- Among our competitive set, Catalina ranked 9th in Average Daily Rate for Hotels and 2nd for STRs (high to low)
- March Hotel Average Daily Rate was up 11.4% @ $205.57 vs. $184.58 in 2022
- March Short-Term Rental Average Daily Rate was down by 3.9% @ $521.00 vs. $542.00 in 2022
Hotel and Short-Term Rental Revenue Per Available Room from Smith Travel and AIRDNA

- Among our competitive set, Catalina ranked 10th for hotels and 3rd for STRs in Revenue Per Available Room (high to low)
- March Hotel Revenue Per Available Room was up .1% @ $128.21 vs. $121.49 in 2022
- March Short-Term Rental Revenue Per Available Room was $257.00, down 14.9% from $302.00 in 2022
Visitors Services
Catalina Island Visitor Center
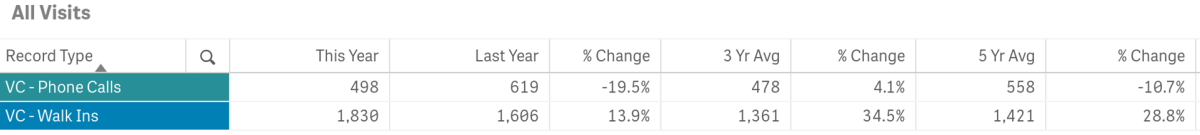
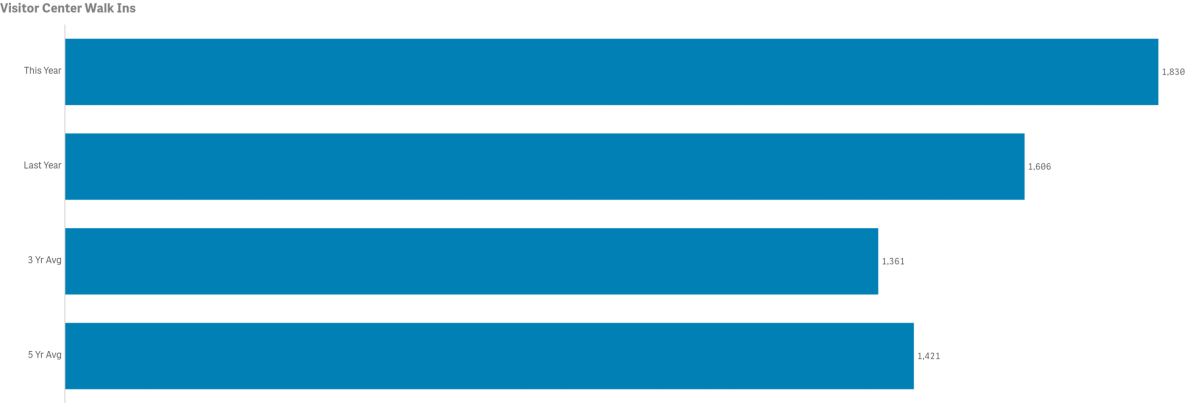
- Walk-ins for the month were up year-over-year by 13.9% @ 1,830 vs. 1,606 in 2022
- 2019 has the highest volume for the month @2,436
- 2020 had the lowest volume for the month @ 584
- March walk-in counts were above the three and five-year averages by 34.5% and 28.8% respectively
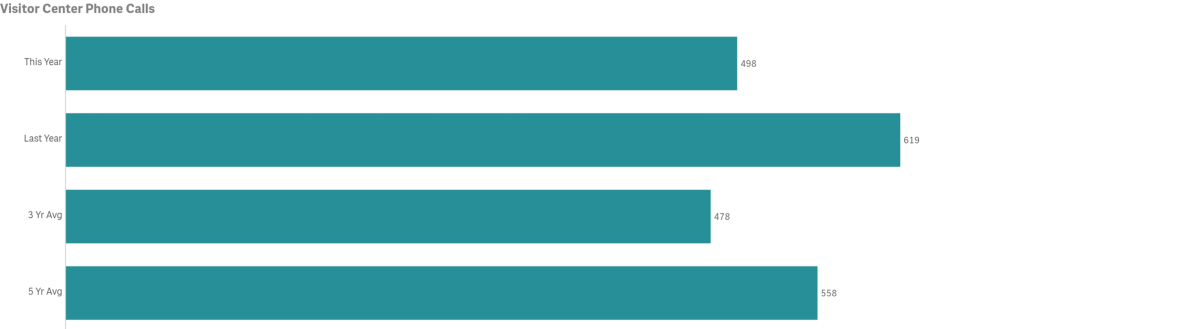
- The number of Phone Calls for the month was down by 19.5% year-over-year @ 498 vs 619
- 2007 had the highest volume of calls for the month @ 1,815
- 2020 had the lowest volume of calls for the month @ 318
- March calls were above the three-year average by 4.1% but below the five-year average by 10.7%
LoveCatalina.com
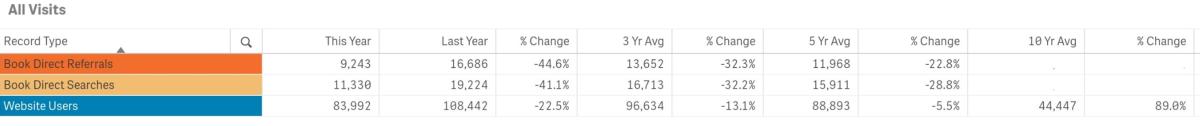
- March LoveCatalina.com total website traffic was down year-over-year by 22.5% @ 83,992 vs 108,442 in 2022
- March total website users were below the three and five-year averages by 13.1% and 5.5% but above the ten-year average by 89.0%
- Book Direct referrals were down year-over-year by 44.6% @ 9,243 vs. 16,686 in 2022
- Book Direct lodging searches were down 41.1% @ 11,330 vs.19,224 in 2022
Note changes to Book Direct in 2021 resulted in shifting traffic between referrals and searches
Visitor Guides & Newsletters
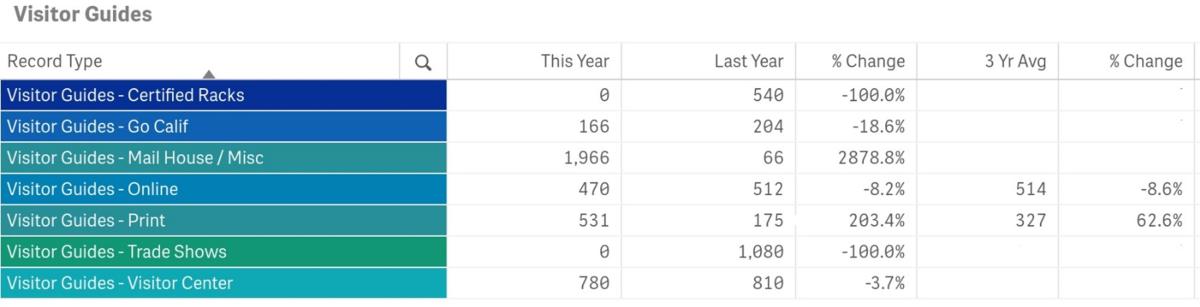
Note measures now include additional source tracking for months and years in which distributions were made
- Go California Print Guide orders totaled 166, down from 204 in 2022
- 1,966 Guides were delivered via Mail House for the month, up from 66 in 2022
- Online Guide downloads were down @ 470 vs. 512 in 2022
- Printed Visitor Guide orders on LoveCatalina.com @ 531, were up from 175 last year
- Guides delivered to the Visitor Center totaled 780, down from 810 in 2022
- No Guides were delivered to Certified Racks during the month but were distributed from inventory on hand
Note, no 2021 Guide was printed and 2022 guide distribution initiated in late February 2022, resulting in more online guide orders. Some distributor’s tracking is running behind and will be updated as received.
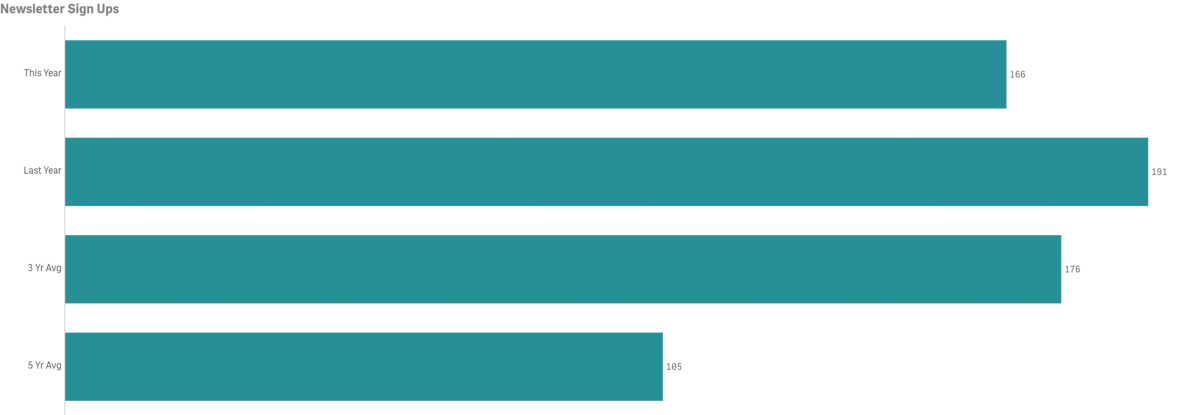
- New E-newsletter subscribers in March were down year-over-year @ 166 vs 191 in 2022
- New subscribers for the month were below the three-year average of 176 but above the five-year average of 105
Social Media
Cumulative totals by platform as of March below
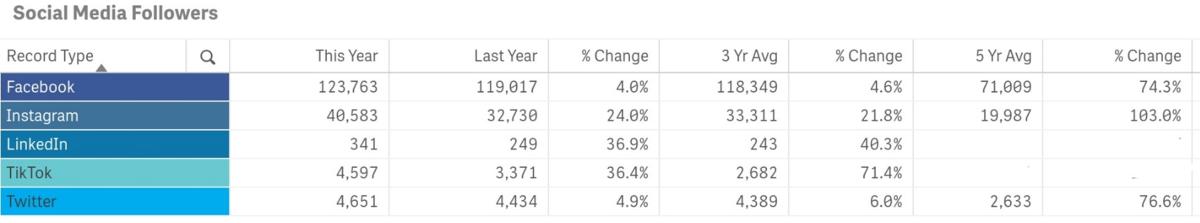
- Facebook followers are up year-over-year by 4.0%
- Instagram followers are up year-over-year by 24.0%
- Twitter followers are up year-over-year by 4.9%
- LinkedIn followers are up year-over-year by 36.9%
- TikTok is up year-over-year by 36.4%.
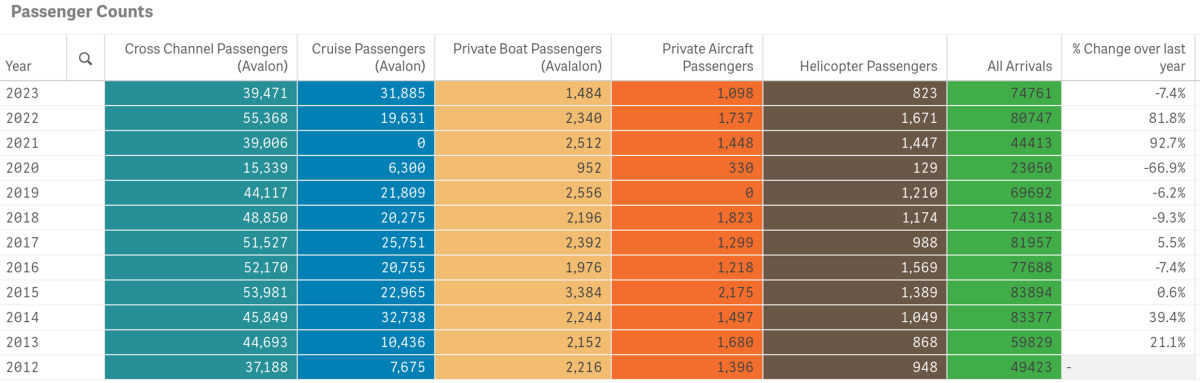
Year-to-date—Historical Arrivals
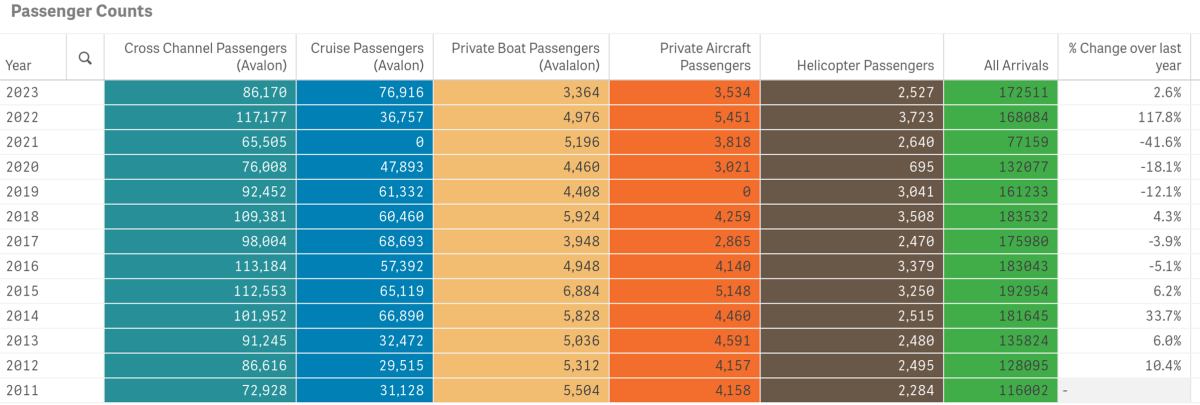
COVID-19 and pre-Covid-19 comparrison data is illustrated in the snapshot above (January – March)
Below is a graph of year-to-date and mutli-year comparissons of all arrivals by sector
- 2015 had the highest total visitation year-to-date @ 192,954, a difference of 20,443 visitors vs 2023
- 2021 had the lowest year-to-date total visitation @ 77,159
To view historical data for total arrivals by sector, year and month in a spreadsheet form click here.
Year-to-date Lodging
Hotel and Short-Term Rental Occupancy from Smith Travel and AirDNA

- Hotel Occupancy January through March 2023 was 58.7% vs. 59.0% tracked for the same time period in 2022
- Short-Term Rental Occupancy was 47.3%, down from 51.0% in 2022
- According to Smith Travel, Catalina’s average YTD Hotel Occupancy of 58.7% was below the YTD occupancy for all of our competing destinations except for Monterey
- According to AirDNA, Catalina’s average Short-Term Rental YTD Occupancy of 47.3% was above Palm Springs, but below all other destinations in our competitive set
Year-to-date Visitor Services
Catalina Island Visitor Center
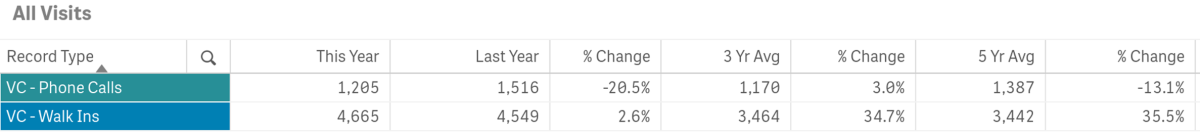
- The number of Phone Calls year-to-date are down by 20.5% @ 1,205 vs. 1,516 in 2022
- Year-to-date Phone Calls exceeded the three-year average, but are below the five-year average
- Number of Walk-Ins year-to-date are up @ 4,665 vs. 4,549 or 2.6%
- Year-to-date Walk-In counts were above the three and five-year averages
Year-to-date LoveCatalina.com
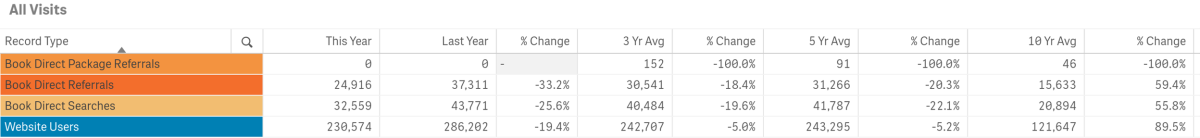
- LoveCatalina.com website users were down year-to-date by 19.4% @ 230,574 vs.286,202 in 2022
- Book Direct lodging searches were down by 25.6% @ 32,559 vs. 43,771 in 2022
- Book Direct referrals were down by 33.2% @ 24,916 vs. 37,311 in 2022
- Book Direct Package referrals were not active on our site
Note changes to Book Direct on member links has resulted in shifting some traffic to referrals vs. searches
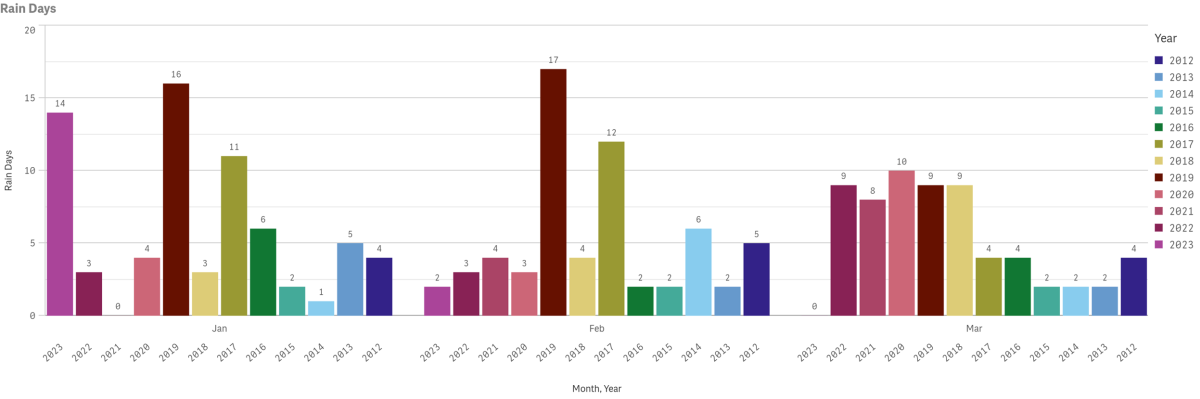
Weather
Data for March highs, lows and precipitation is not currently available due to broken feed from the Harbor weather station. Multi-year rain days data is also displayed by year and month since 2012, likewise excluding March of this year. Measures are taken at Avalon Harbor.


Submarine & Inside Land Tours
Catalina Adventure Tours
Book Direct & Save! Tours offered multiple times daily, Submarine tours depart from Green Pier & Inside Land Tours from the Mole.

$10 Off Catalina Island Ferry
Onboard Catalina Flyer
Hop onboard the Catalina Flyer for daily ferry service from Newport Beach to Avalon, Catalina Island in just over 1 hour.

