November 2021
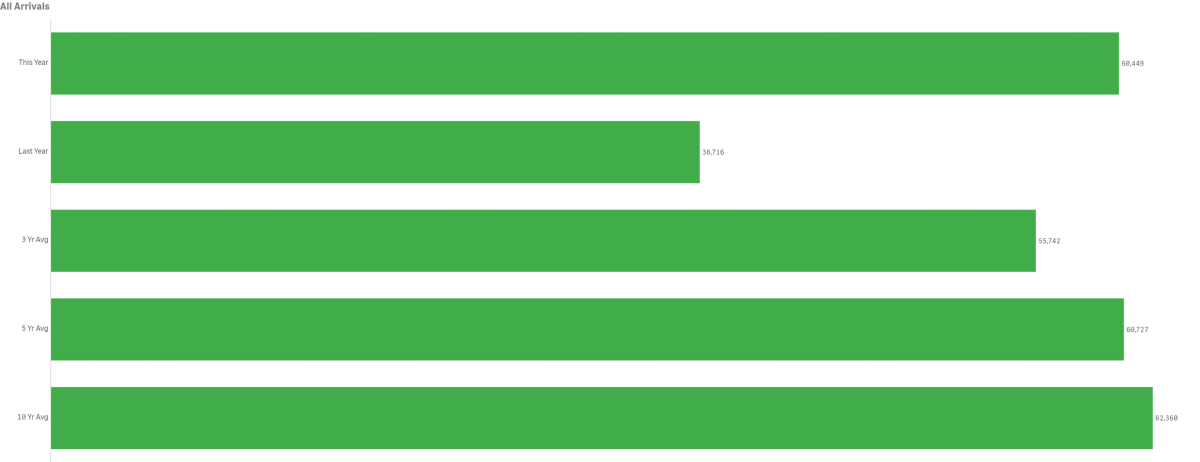
All Arrivals
Despite ongoing impacts from COVID-19 on travel, November visitation increased year-over-year, resulting in an overall increase by 64.6% or 27,773 visitors over the same month last year.

Previous November tracking (below) offers a comparison without COVID-19 impacts. November 2021’s total of 60,449 fell short of November 2019’s pre COVID-19 total arrivals of 70,062.
November’s total in-bound passenger count was above the three-year average of 55,741 but below the five and ten-year averages of 60,727 and 62,360 respectively.
Arrivals by Sea
Passengers arriving by sea, including private boaters, totaled 58,077 for the month of November, up by 68.7% from last year.


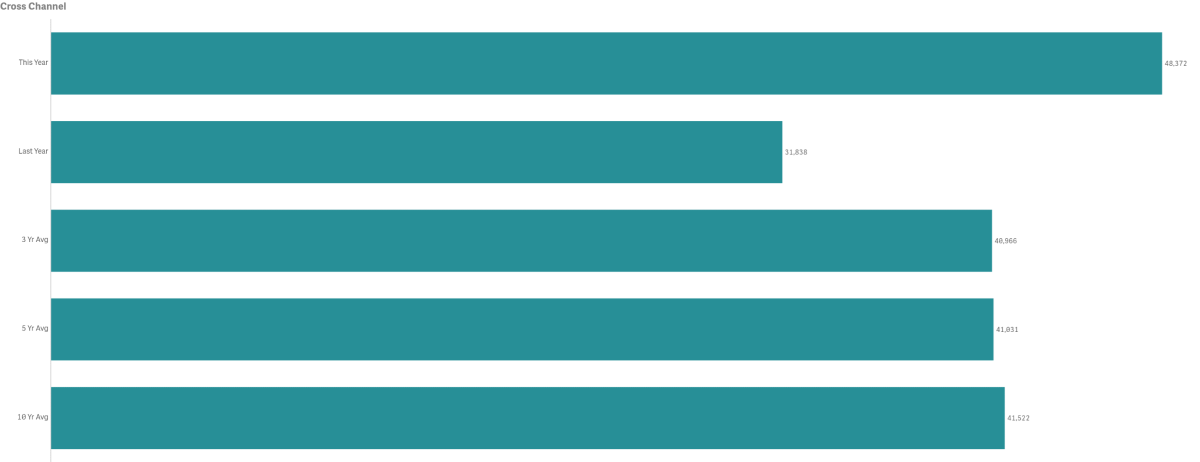
- November Cross Channel Passenger counts were up year-over-year by 51.9% or an increase of 16,534 people
- 2014 had the highest volume for the month @ 50,949 passengers
- 2009 had the lowest volume for the month @ 24,262
- November Cross Channel Passenger counts were above the three, five and ten-year averages by 18.1%, 17.9% and 16.5% respectively
- Cross Channel Passengers made up 80.02% of total monthly arrivals
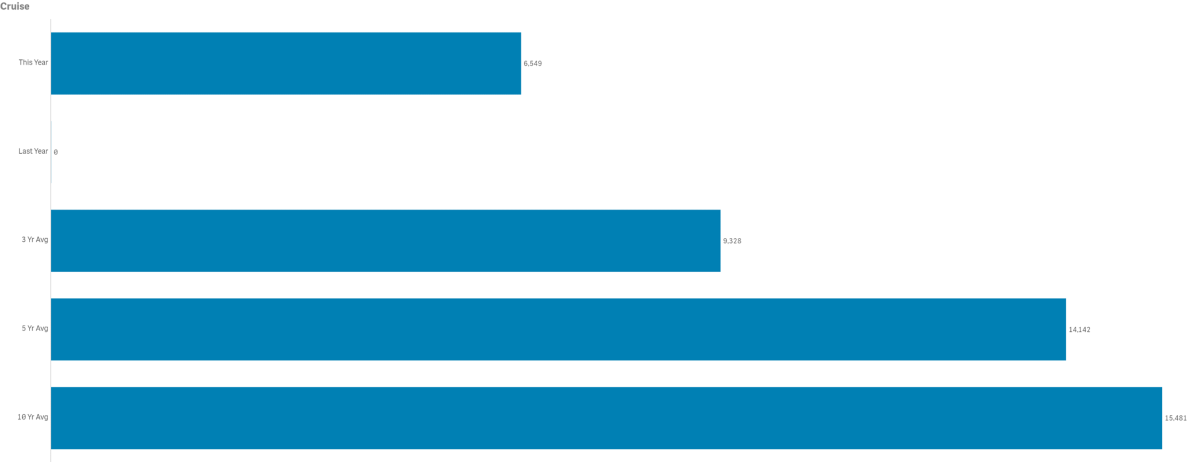
- Cruise passenger counts totaled 6,549
- 2015 had the highest Cruise Passenger volume for the month @ 29,084
- 2020 had the lowest Cruise Passenger volume for the month @ 0. Pre-COVID-19 low was 2011 @ 7,364
- November Cruise Passenger counts were below the three, five and ten-year averages by 29.8%, 53,7% and 57.7% respectively
- Cruise Passengers made up 10.83% of total monthly arrivals
- The number of Cruise Ships calling on Avalon was 5
- 2016 had the largest number of ships @ 11
- 2020 had the lowest number of ships @ 0, pre-COVID-19 2018 had the lowest number @ 6
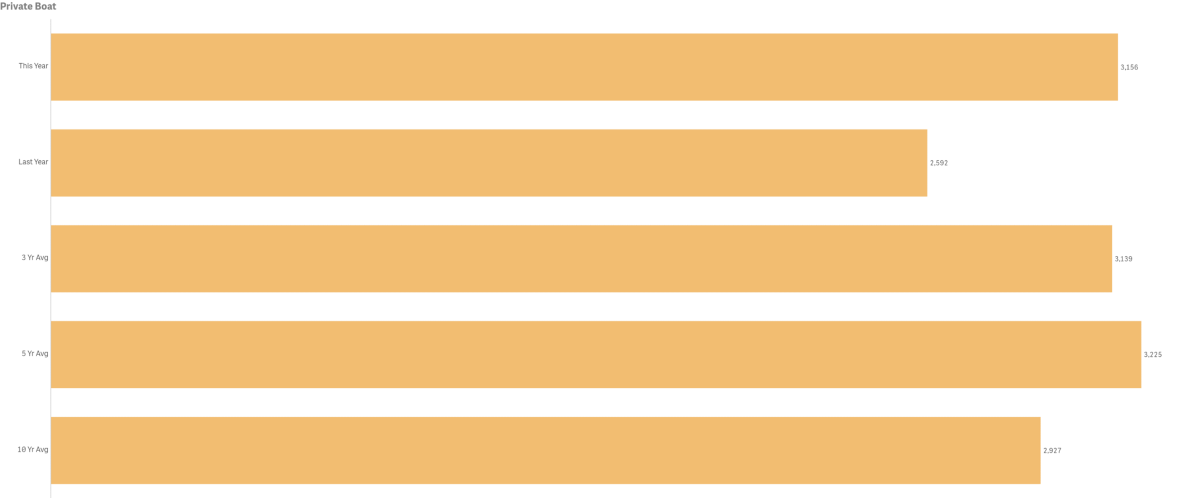
- Private Boater Passenger counts were up year-over-year @ 3,156 vs. 2,592 in 2020
- 2019 had the highest passenger volume for the month @ 3,669
- 2012 had the lowest passenger volume month @ 2,448
- November Private Boater Passenger counts were above the three and ten-year averages by 0.5% and 7.8% respectively but below the five-year average of 3,225 by 2.1%
- November’s number of Vessels Anchored was up @ 99 vs.69 last year
- 2018 had the highest number of Vessels Anchored @ 171
- 2011 had the lowest number of Vessels Anchored @ 4
- November 2021 was above the average number of Vessels Anchored for three and ten-year averages by 17.9% and 32.9% respectively but below the five-year average of 103 by 3.9%
- November’s number of Vessels on Moorings was 789, up 21.8% from 648 last year
- 2019 had the highest number of Vessels on Moorings @ 856
- 2015 had the lowest number of Vessels on Moorings @ 578
- November 2021 was above the three, five and ten-year averages for Vessels on Moorings by 3.2%, 2.7% and 10.7% respectively
- Private Boaters Made up 5.22% of total monthly arrivals
Arrivals by Air
Combined in-bound air passenger counts for November totaled 2,438, up from 2,324 in 2020.
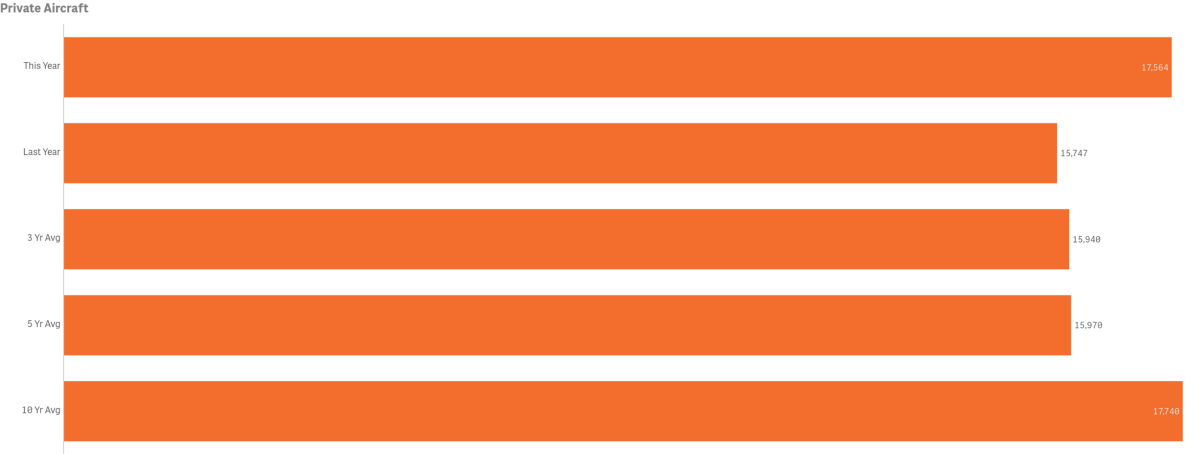
- Private Aircraft Passengers (Airport in the Sky) was down @ 1,593 from 1,620 last year
- 2015 had the highest volume of Private Aircraft Passengers for the month @ 1,773
- 2007 had the lowest volume of Private Aircraft Passengers for the month @1,079
- November counts for Private Aircraft Passengers was above the three, five and ten-year averages by 8.4%, 8.1% and 7.9% respectively
- November Private Aircraft Passengers made up 2.64% of total monthly arrivals
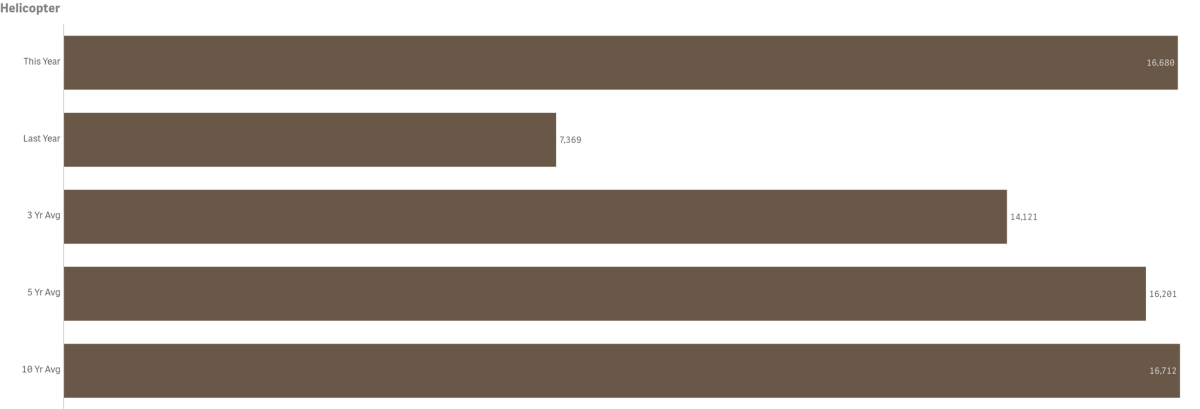
- Helicopter Passenger counts were up 17.0% year-over-year @ 779 vs. 666
- 2015 had the highest volume for the month @ 1,335
- 2011 had the lowest volume for the month @ 623
- November counts for Helicopter Passengers was above the three-year average by 7.7% but below the five and ten-year averages of by 8.9% and 17.3% respectively
- November counts for Helicopter Passengers made up 1.29% of total monthly arrivals
Year-to-Date
Total year-to-date arrivals are up from last year by 55%. Keep in mind that current and multi-year figures include impacts of COVID-19 from present back to March 2020.

- Total Arrivals year-to-date was up @ 764,357 vs. 490,851 last year or a difference of 273,506 visitors
- Total Arrivals year-to-date exceeded the three-year average of 739,930 by 3.3%
- Total Arrivals year-to-date were below the five and ten-year averages of 849,927 and 883,003 respectively
- All arrival sectors are up year-to-date with the exception of Cruise
Year-to-Date--Historical
COVID-19 and pre-Covid-19 comparison data is illustrated below

- 2017 had the highest total visitation year-to-date @ 1,031,953
- 2020 had the lowest year-to-date total visitation @ 490,851
- 2012 had the lowest pre COVID-19 year-to-date @ 783,364
- 2019 had 964,582 visitors year-to-date
- All arrival sectors are up 2021 year-to-date compared to 2019 with the exception of Cruise
To view historical data for total arrivals by sector, year and month in a spreadsheet form click here. PDF File.
Lodging
NEW data sets added this month include Hotel and Short-Term Rental Occupancy from Smith Travel and AIRDNA.
- Hotel Occupancy for November 2021 was 67.8%, up from 49.4% in 2020
- November 2021 Hotel Occupancy exceeded Palm Springs, San Diego, Huntington Beach, Monterey, Anaheim and San Francisco in our competitive set, but was below Santa Barbara, Newport Beach and Santa Monica
- Short-Term Rental Occupancy for November was 42%, down from 49% in 2020
- November 2021 Short-Term Rental Occupancy exceeded no destinations in our competitive set but was below Palm Springs, Santa Barbara, San Diego, Newport Beach, Huntington Beach, Monterey, Anaheim, San Francisco and Santa Monica
Visitor Services
November Visitor Services were up year-over-year.
Catalina Island Visitor Center

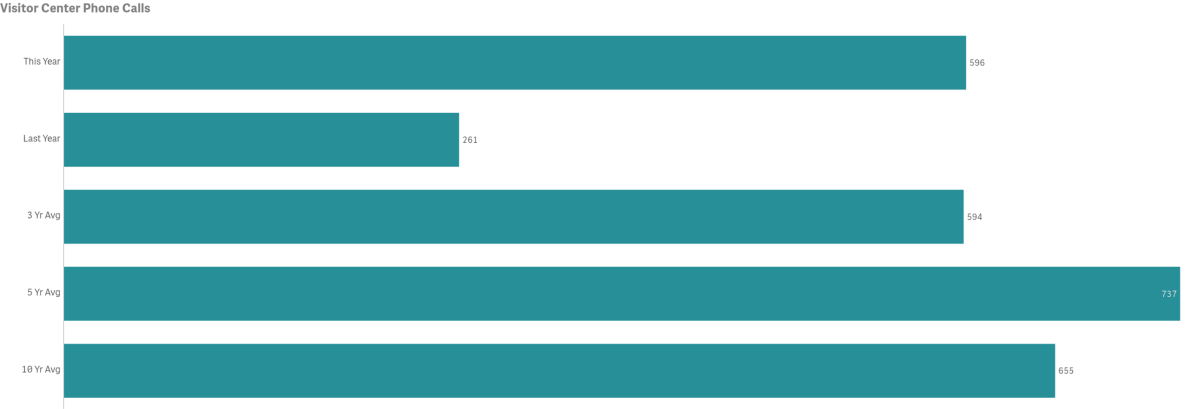
- Number of Phone Calls for the month was up year-over-year by 128.4% @ 596 vs. 261
- 2007 had the highest volume for the month @ 1,108 calls
- 2020 had the lowest volume for the month @ 261 calls. Pre-COVID-19 lowest call volume was 2015 @ 464
- November call counts were on par with the three-year average of 594
- Note that a change in New Year’s Eve Gala reservations (launched each year in August) from phone to online has resulted in significant reduction in 2021 phone calls. No New Year’s Gala tickets were sold in 2020
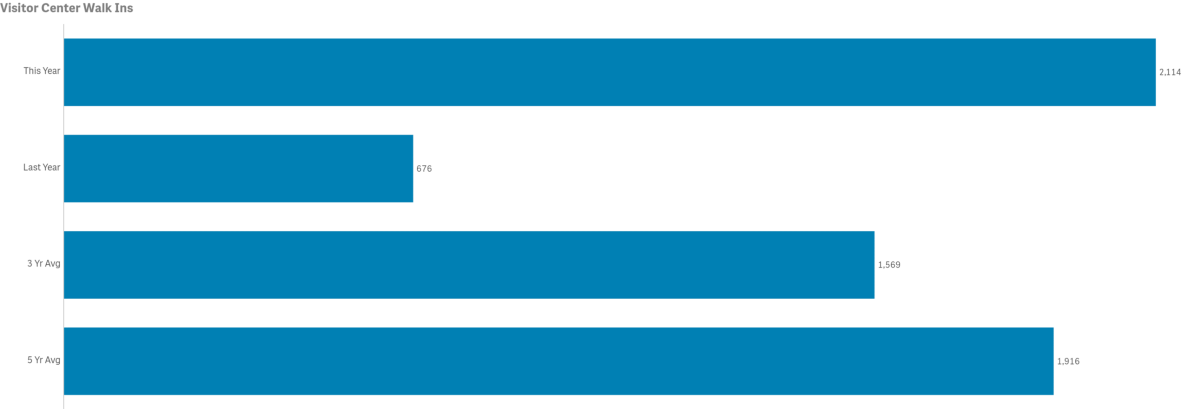
- Number of Walk-Ins for the month was up year-over-year @ 2,114 vs. 676
- 2016 had the highest volume of Walk-ins for the month @ 3,241 guests
- 2020 had the lowest volume of Walk-ins for the month @ 676 guests. Pre COVID-19 lowest volume of guests was 2019 @ 1,918
- November Walk-In counts were above the three, five and ten-year average of 1,569, 1,916 and 1,282 respectively
- Note Walk-In traffic is greatly impacted by Cruise visits and November 2021 was the second full-month of ships calling on Avalon since February of 2020
LoveCatalina.com

- November LoveCatalina.com website users were up year-over-year by 48.3% @ 61,936 vs. 41,754 in 2020
- Book Direct lodging searches were up year-over-year by 39.7% @, 8,096 vs. 5,795 in 2020
- Note changes to Book Direct on member links has resulted in shifting more traffic to referrals vs. searches
- Book Direct referrals were up by 48.3% @ 61,936 vs.41,754 in 2020

- Note above numbers do not include rack and California Welcome Center/local Visitor Center distributions
- Printed Visitor Guide orders @ LoveCatalina.com @ 32, down from 259 or 87.6% from last year
- No 2021 Guide was printed
- Online Guide downloads were up by 316.5% @ 329 vs.79 in 2020
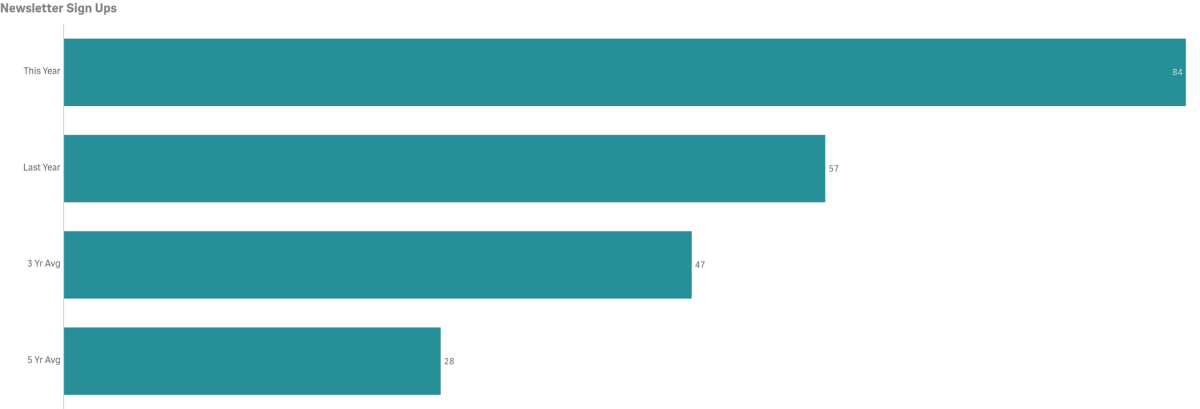
- New E-blast subscribers in November were up year-over-year @ 64 vs. 57 in 2020
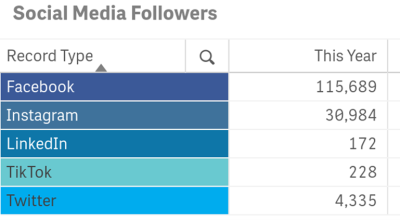
Social Media cumulative totals by platform as of November below.
Weather
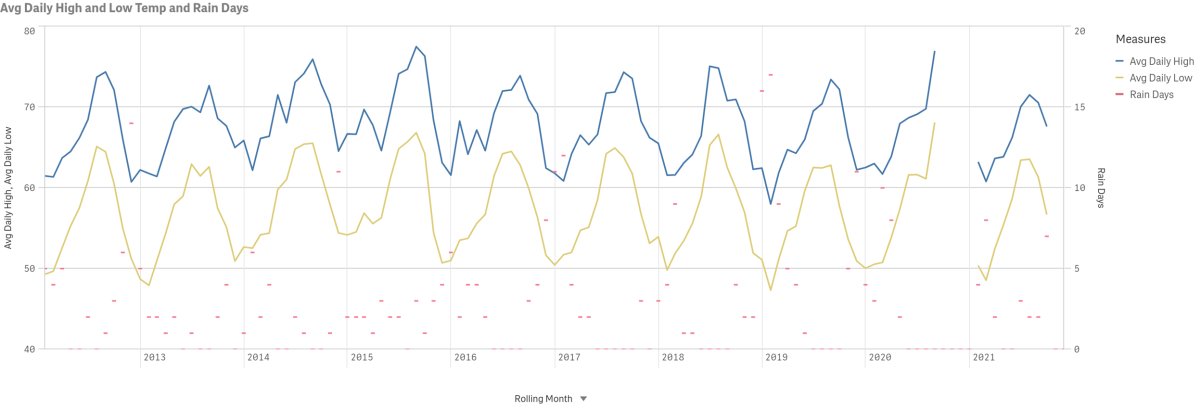
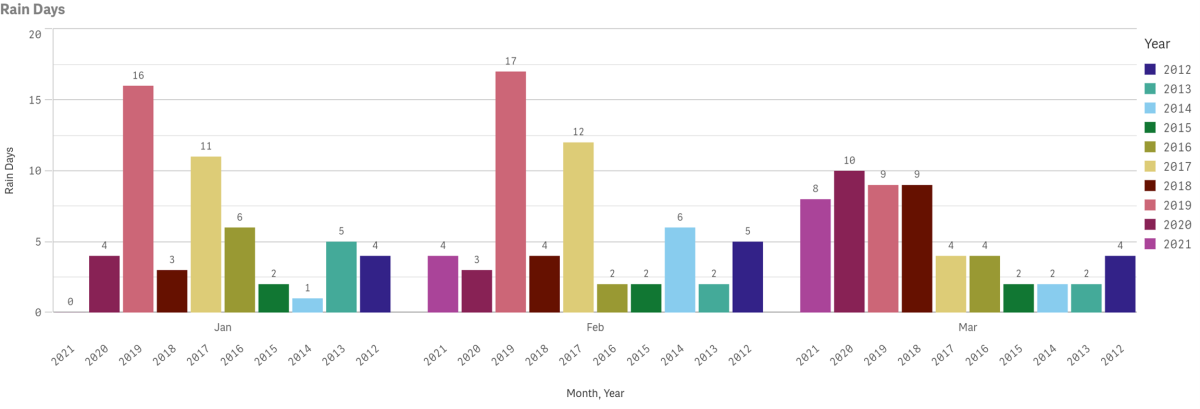
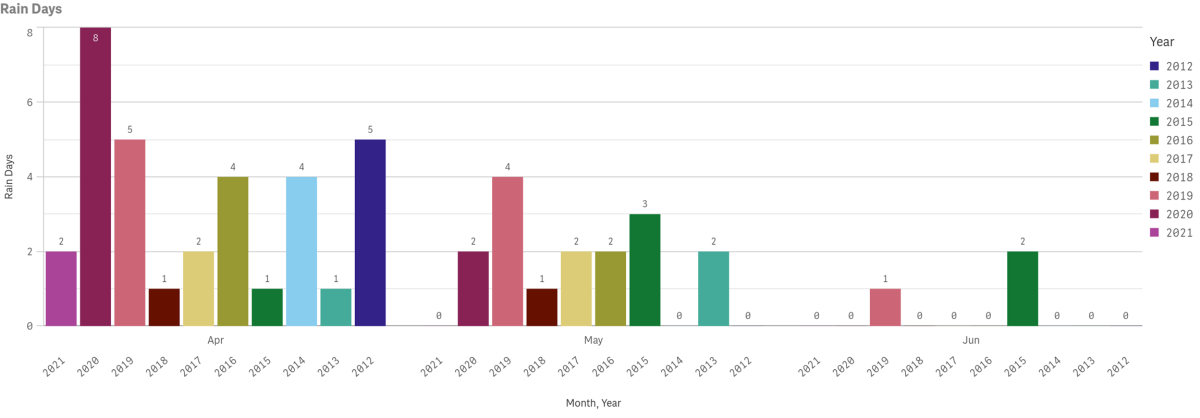
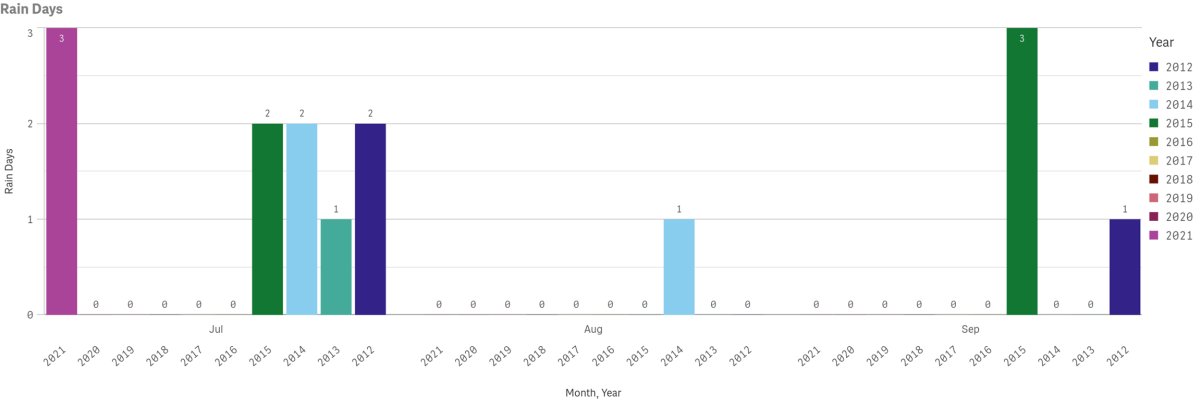
Data for November highs, lows and precipitation going back to 2012 is displayed below. Multi-year rain days data is also displayed by year and month. Measures are taken at Avalon Harbor.
Catalina Flyer from Newport
$10 Off Catalina Island Ferry
Hop onboard the Catalina Flyer for daily ferry service from Newport Beach to Avalon, Catalina Island in just over 1 hour.
Catalina Sea Spa
Recharge with massages starting at $110.
Discover Bliss at Catalina Sea Spa! Book online or call 310-510-8920. Treat yourself and escape to relaxation today!
