
May 2021
May continued to show significant signs of recovery from the COVID-19 related closures. Per public health orders, May 2020 visitation was limited due to COVID-19 based travel restrictions. Accordingly references to 2019 and prior years are provided where important to provide a more normal comparison.
All Arrivals
May visitation increased year-over-year in all sectors, except cruise visitors, resulting in an overall increase by 72,159 visitors over the same month last year.
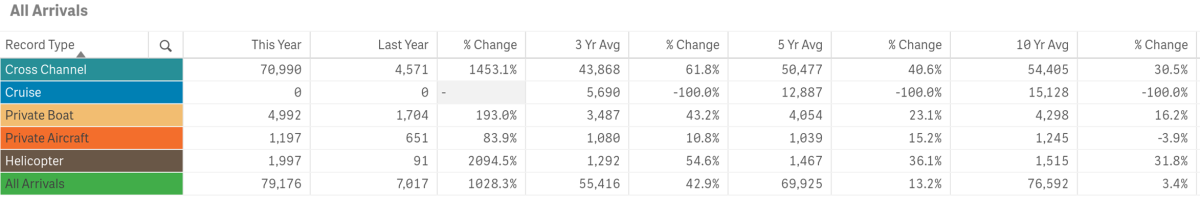
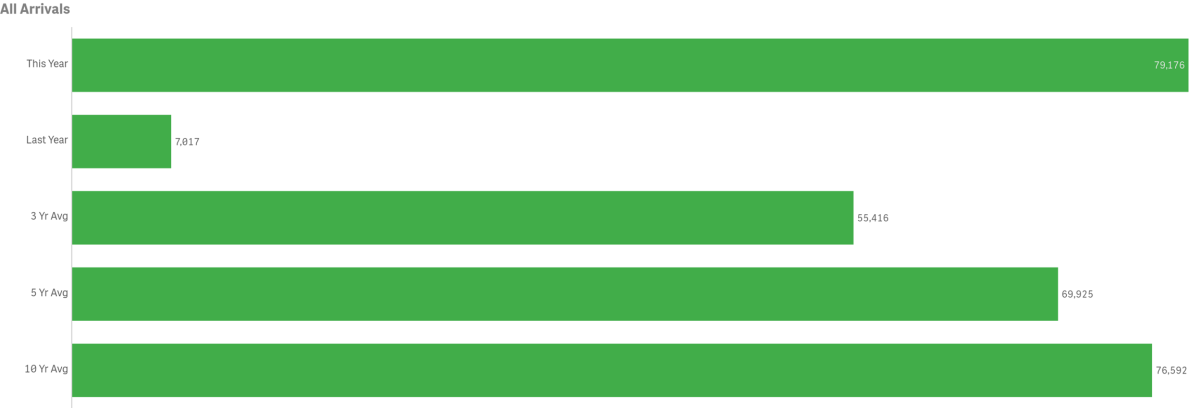
Previous May tracking (2019 and preceding) offers a comparison with no COVID-19 impacts. May 2021’s total of 79,176 nearly matched May 2019’s total arrivals of 80,005.

May 2021’s total in-bound passengers = 79,176, up from last year @ 7,017. May 2021 was above the three-year average of 55,416. May was just above the five-year average of 69,925 and also above the ten-year average of 76,592 by 3.4%. May 2021 trailed May 2019 by only 879 visitors.
Arrivals by Sea
Passengers arriving by sea, including private boaters, was 75,982 for the month of May, up by 69,707 from 6,275 last year.
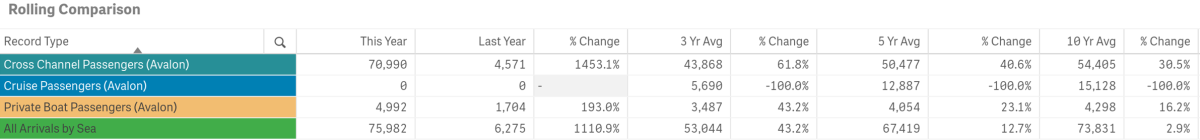
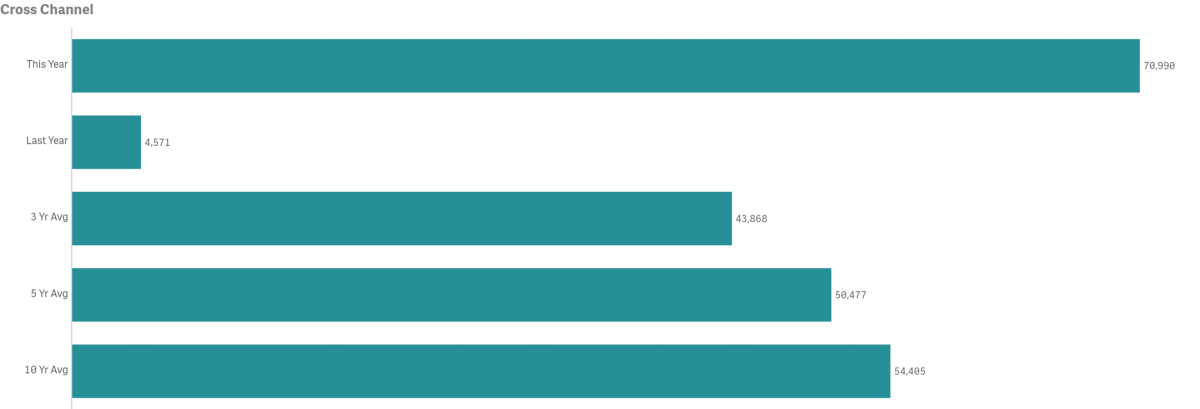
- May Cross Channel passenger counts were up year-over-year @ 70,990 vs. 4,571 last year
- 1997 had the highest volume for the month @ 73,288 Cross Channel passengers
- 2020 had the lowest volume for the month @ 4,571. Pre-COVID-19 the lowest count for the month was in 2007 @ 42,242
- 2019 had 56,042 Cross Channel passengers or 14,948 fewer than 2021
- May Cross Channel passenger counts were above the three-year average of 43,868 by 61.8%
- May Cross Channel passenger counts were above the five-year and ten-year averages of 50,477 and 54,405 respectively
- Cross Channel Carriers made up 89.66% of total monthly arrivals
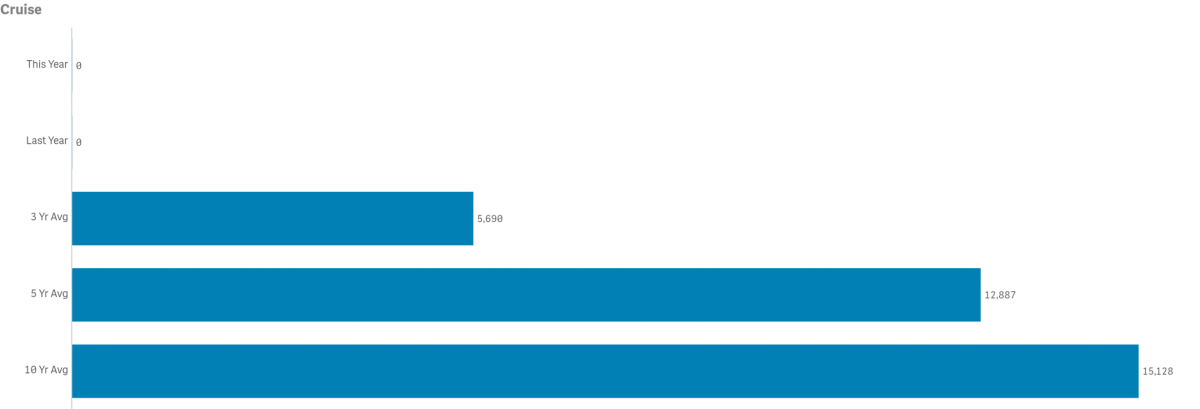
- May’s Cruise passenger counts were 0 for the second year
- 2009 had the highest Cruise passenger volume for the month @ 51,141
- 2021 tied with 2020 as the lowest Cruise passenger volume for the month @ 0. Previous low was 1991 @ 5,990
- 2019 May Cruise passenger counts totaled 17,070
- May Cruise passenger counts were below the three-year average of 5,690 (note two of three years @ 0)
- May Cruise passengers counts were below the five-year and ten-year averages of 12,887 and 16,128 respectively
- Cruise passengers made up 0% of total monthly arrivals
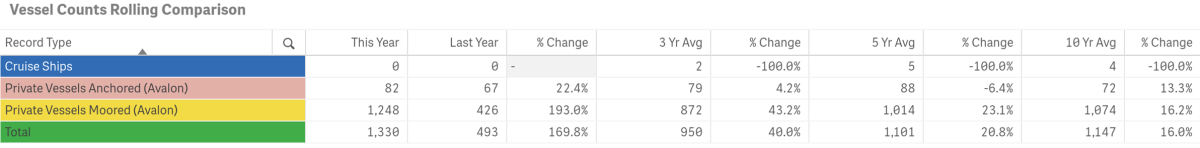
- The number of Cruise Ships calling on Avalon was 0 as was May 2020
- 2017 had the highest number of Cruise Ships in port for the month @ 11
- 2021 and 2020 had the lowest number of Cruise Ships in port @ 0. Previous low was in 2019 @ 7
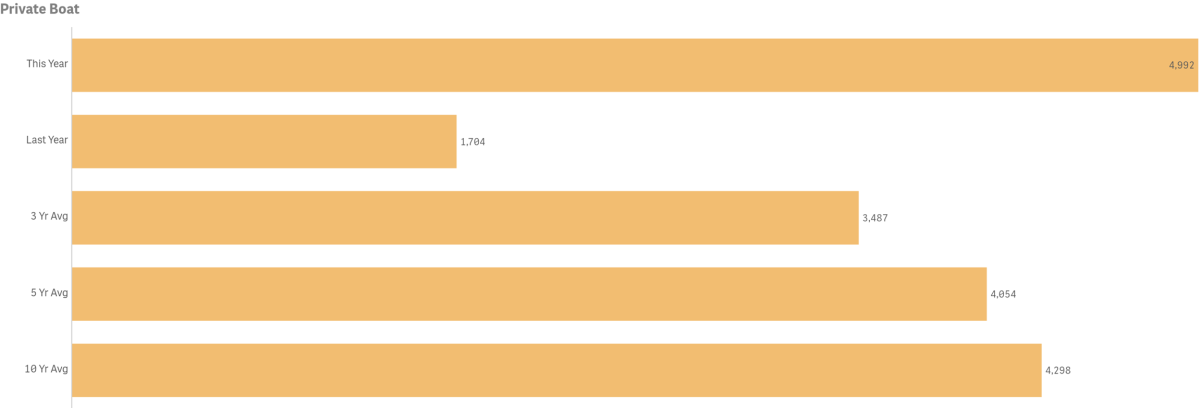
- Private Boater passenger counts were up year-over-year by 193% @ 4,992
- 2014 had the highest passenger volume for the month @ 5,012
- 2020 had the lowest passenger volume month @ 1,704. The prior lowest was 3,764 in 2019.
- May Private Boater passenger counts were above the three-year average of 3,487 by 43.2%
- May Private Boater passenger counts were above the five-year and ten-year average of 4,054 and 4,298 respectively
- May’s number of Boats on Anchor was up by 22.4% @ 82 vs. 67 last year
- 2018 had the highest number of vessels at anchor @ 115
- 2013 had the lowest number of vessels at anchor @ 13
- May’s number of Boats on Moorings was up @ 1,248 vs. 425 last year
- 2014 had the highest number of vessels on moorings @ 1,253
- 2020 had the lowest number of vessels on moorings @ 426. The prior lowest count was in 2019 @ 941
- Private Boaters Made up 6.30% of total monthly arrivals
 .
.
Arrivals by Air
Combined in-bound air passenger counts for May totaled 3,272, up from 742 in 2020.
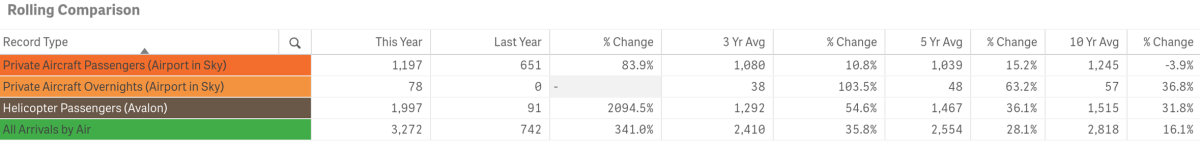
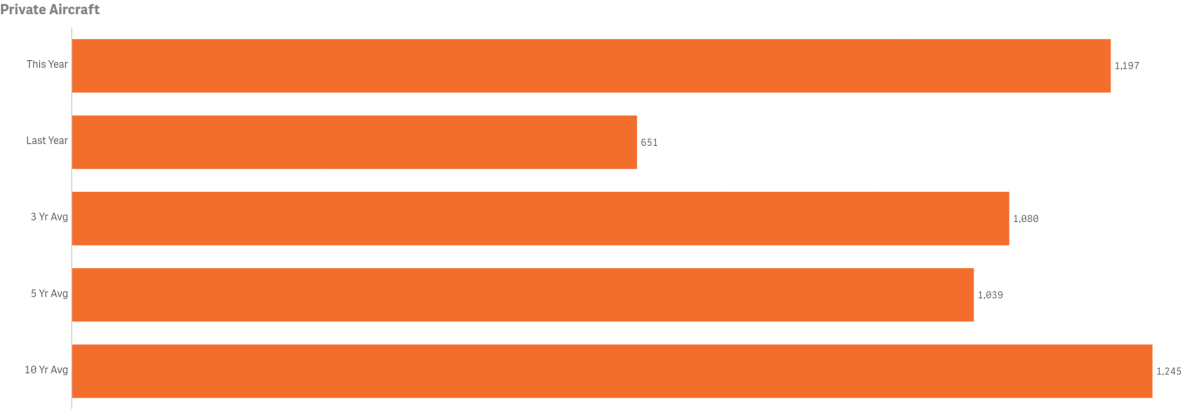
- Private Aircraft Passengers (Airport in the Sky) was up @ 1,197 from 651 last year
- 2014 had the highest volume of Private Aircraft Passengers for the month @ 1,818
- 2020 had the lowest Private Aircraft Passenger counts for the month @ 651. The prior lowest count was in 2018 @ 873
- May counts for Private Aircraft Passengers was above the three-year average of 1,080 by 10.8%
- May counts for Private Aircraft Passengers was below the five-year and ten-year averages of 1.039 and 1,245 respectively
- May Private Aircraft Passengers made up 1.51% of total monthly arrivals
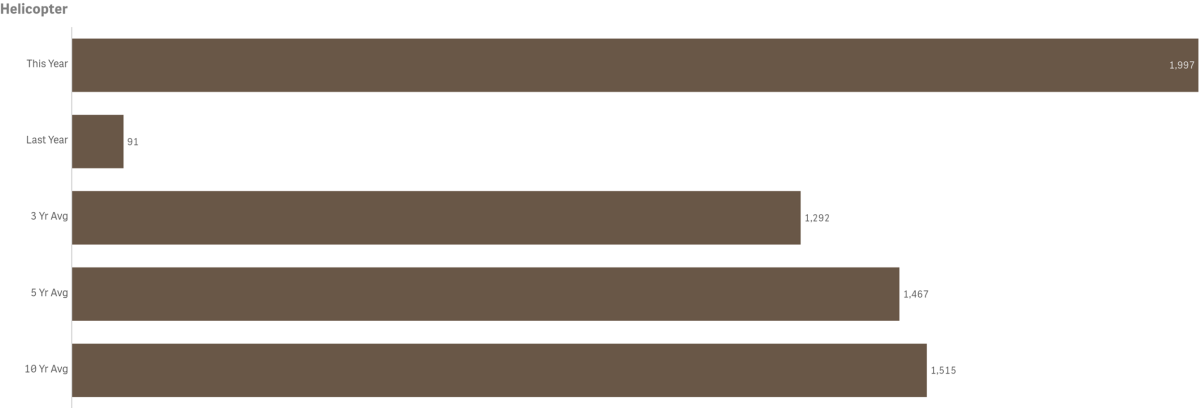
- Charter Helicopters Passengers was up year-over-year @ 1,997 vs. 91
- 2021 had the highest volume for the month @ 1,997
- 2020 had the lowest volume for the month @ 91. Previous low for month was 1,412 in 2009
- May counts for Helicopters Passengers was above the three-year average of 1,292 by 54.6%
- May counts for Helicopters Passengers was above the five-year and ten-year averages by 1,467 and 1,515 respectively
- May Helicopter Passengers made up 2.52% of total monthly arrivals
Year-to-Date
Total year-to-date arrivals are up from last year
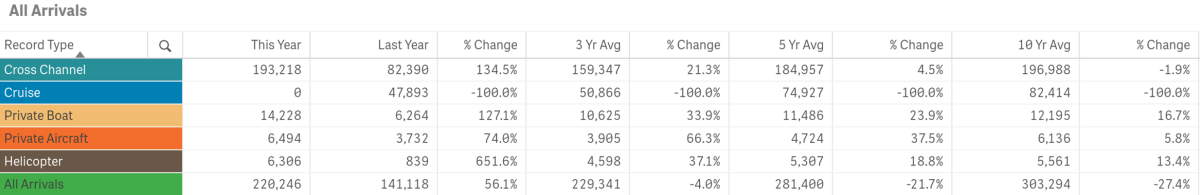
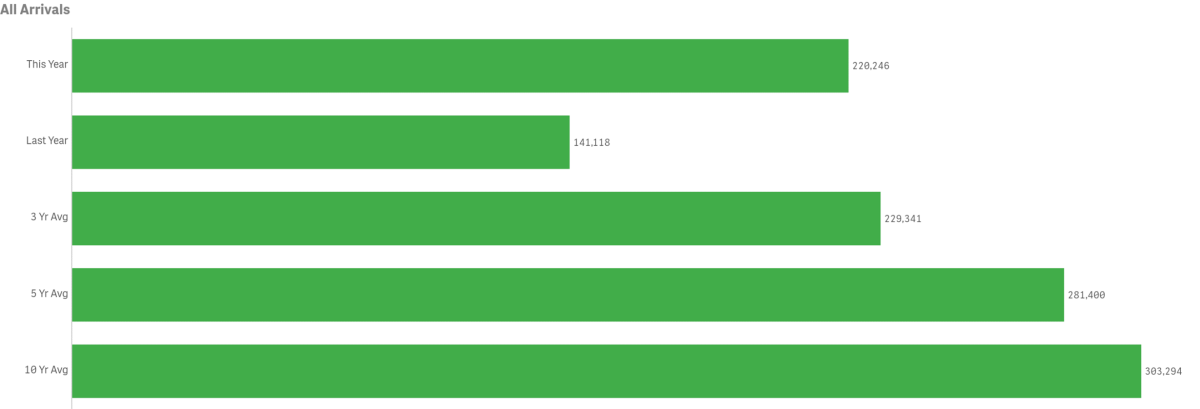
- Total Arrivals year-to-date was up 56.1% from last year @ 220,246 vs. 141,118 or a difference of 79,128 visitors
- Total Arrivals year-to-date remain below the three, five and ten year averages by 4.8%, 21.7% and 27.4% respectively
- All arrival sectors are up year-to date except for Cruise
Year-to-Date--Historical
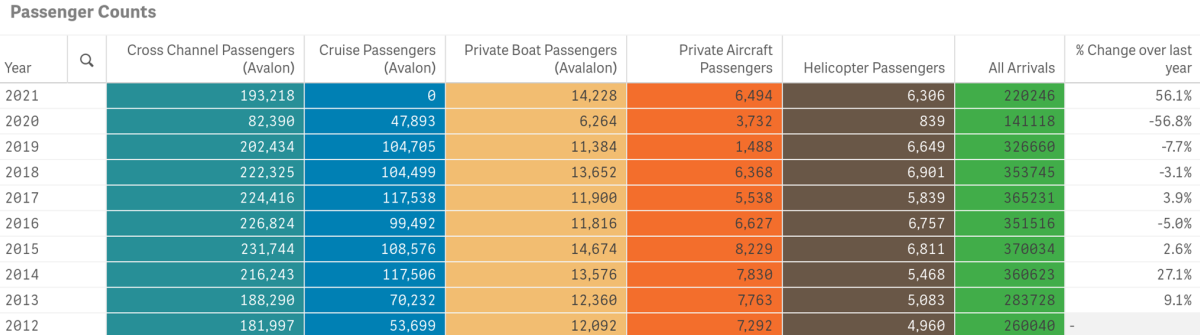
- 2017 had the highest total visitation year-to-date @365,231.
- Compared to 2017, year-to-date total arrivals are down by 144,985
- 2019 had 326,669 visitors year-to-date
- Compared to 2019, year-to-date total arrivals are down by 105,535 people
- Cross Channel, Cruise and Helicopter arrivals are down year-to-date compared to 2019 while Private Boat and Private Aircraft are up.
To view historical data for total arrivals by sector, year and month in a spreadsheet form click here. PDF File.
Visitor Services
May Visitor Services increased year-over-year in all measures.
Catalina Island Visitor Center

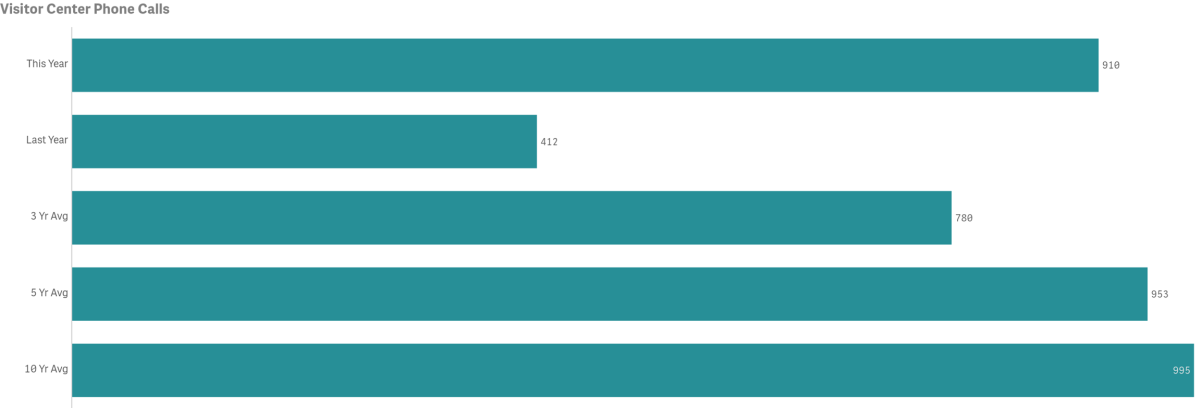
- Number of Phone Calls for the month was up year-over-year by 120.9% @ 913 vs. 412
- 2007 had the highest volume for the month @ 1,898 calls
- 2020 had the lowest volume for the month @ 412 calls. Pre-COVID-19 lowest was 2016 @ 734
- May call counts were above the three-year average of 780 by 16.7%
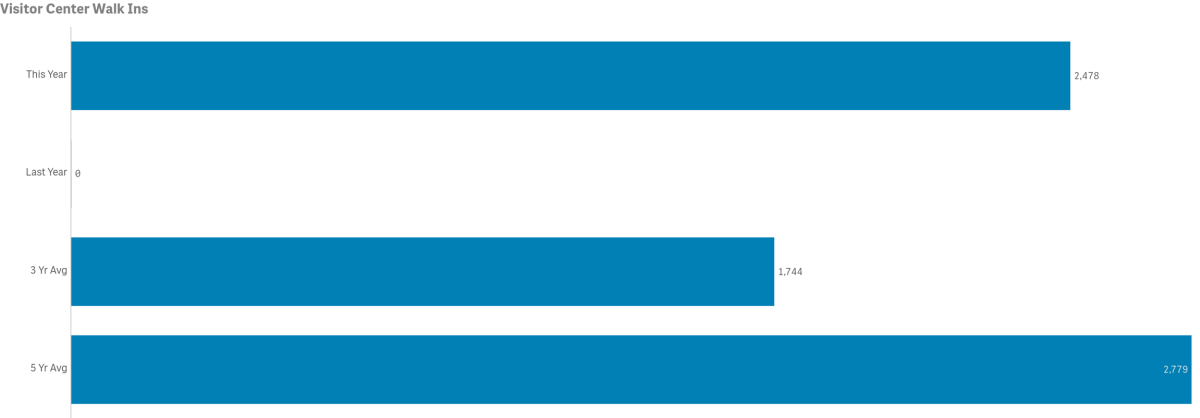
- Number of Walk-Ins for the month was up year-over-year @ 2,478 vs. 0. In May 2020 the Visitor Center was closed to walk-ins due to COVID-19 restrictions.
- 2018 had the highest volume for the month @ 5,426 guests
- 2020 had the lowest volume for the month @ 0 guests. Pre-COVID-19 lowest was 2,753 in 2019
- May Walk-In counts were above the three-year average of 1,744 by 42.1%
LoveCatalina.com

May LoveCatalina.com Website users totaled 119,997 vs. 61,370 in 2020, an increase of 95.5%
Monthly Book Direct lodging searches 23,883
Monthly Book Direct referrals 24,464
May 2021 Printed Visitor Guide orders placed via LoveCatalina.com @ 126
May 2021 Online Guide downloads @ 753
Monthly E-blast consumer sign-ups @ 211
Social Media
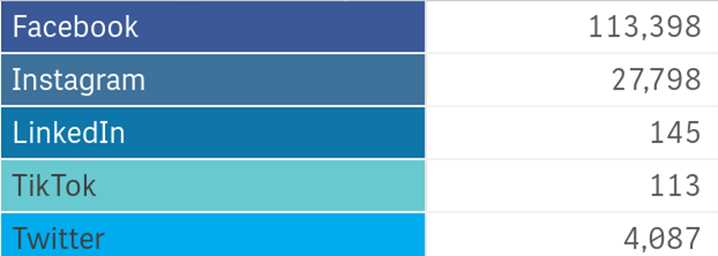
May cumulative followers were 113,398 on Facebook,
May cumulative followers were 27,798 on Instagram
May cumulative followers were 145 on LinkedIn
May cumulative followers were 113 on TikTok
May cumulative followers were 4,087 on Twitter
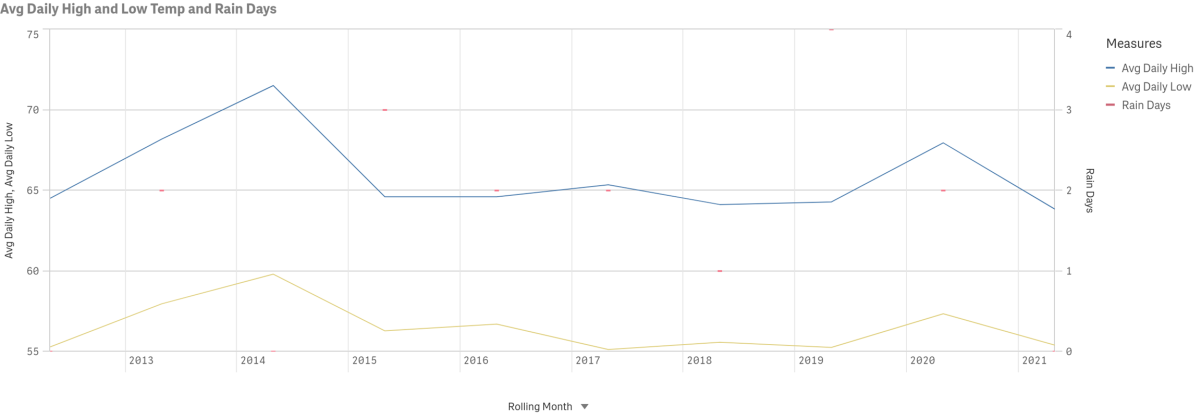
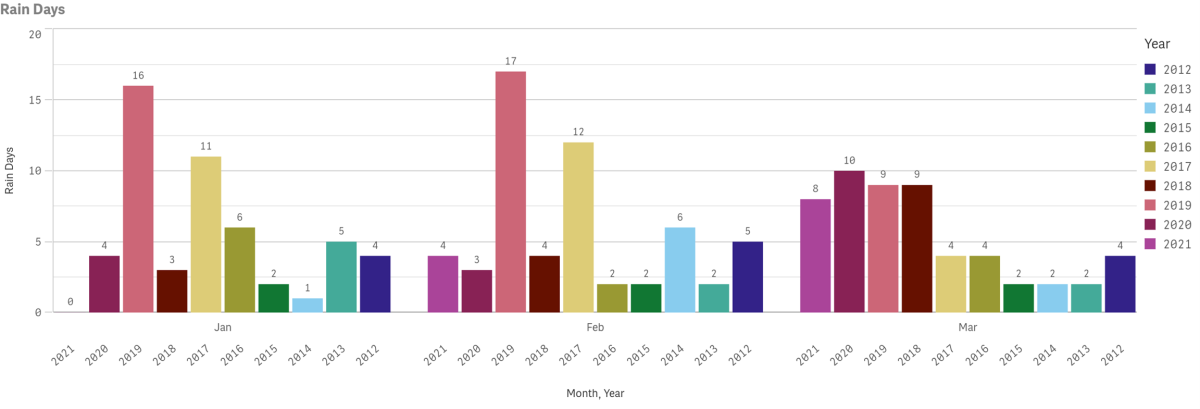
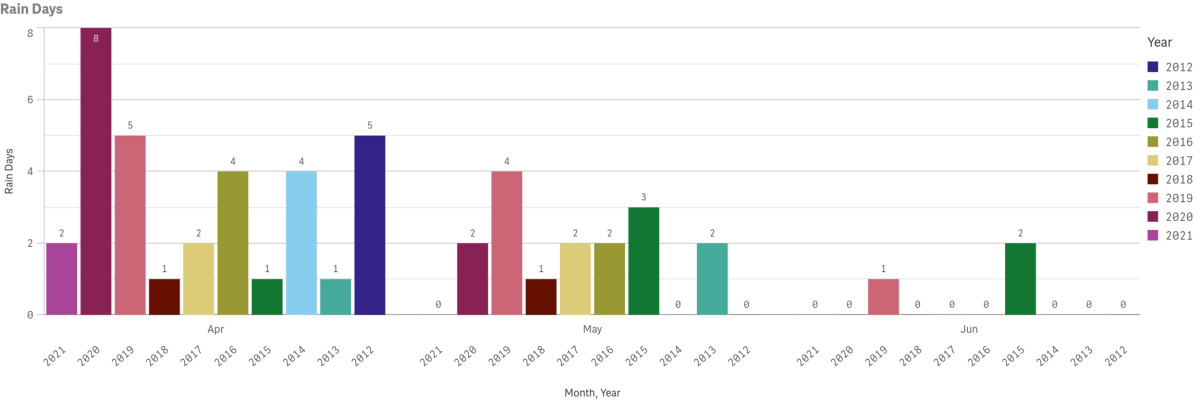
Weather
Data for May highs, lows and precipitation going back to 2012 is displayed below. Multi-year rain days data is also displayed by year and month. Measures are taken at Avalon Harbor.


Catalina Flyer from Newport
$10 Off Catalina Island Ferry
Hop onboard the Catalina Flyer for daily ferry service from Newport Beach to Avalon, Catalina Island in just over 1 hour.

Catalina Sea Spa
Recharge with massages starting at $110.
Discover Bliss at Catalina Sea Spa! Book online or call 310-510-8920. Treat yourself and escape to relaxation today!

