March 2020
March 2020 was greatly impacted by shutdowns related to COVID-19.
All Arrivals
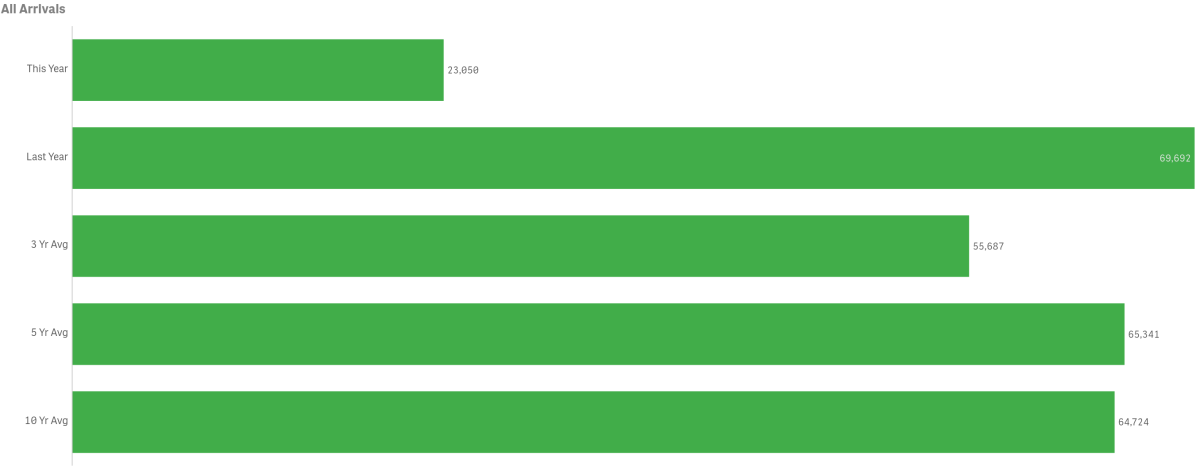
March visitation decreased year-over-year in all sectors, resulting in a total decrease of 66.9% in passengers over the same month last year.

March’s total in-bound passengers = 23,050, down from last year @ 69,692. March 2020 was below the three-year average of 55,687 by 58.6%. March was below the five-year average of 65,341 by 64.7% and the ten-year average of 64,724 by 64.4%.
Arrivals by Sea
People arriving by sea, including private boaters, was 22,591 for the month of March was down 67.8% from 68,482 last year.

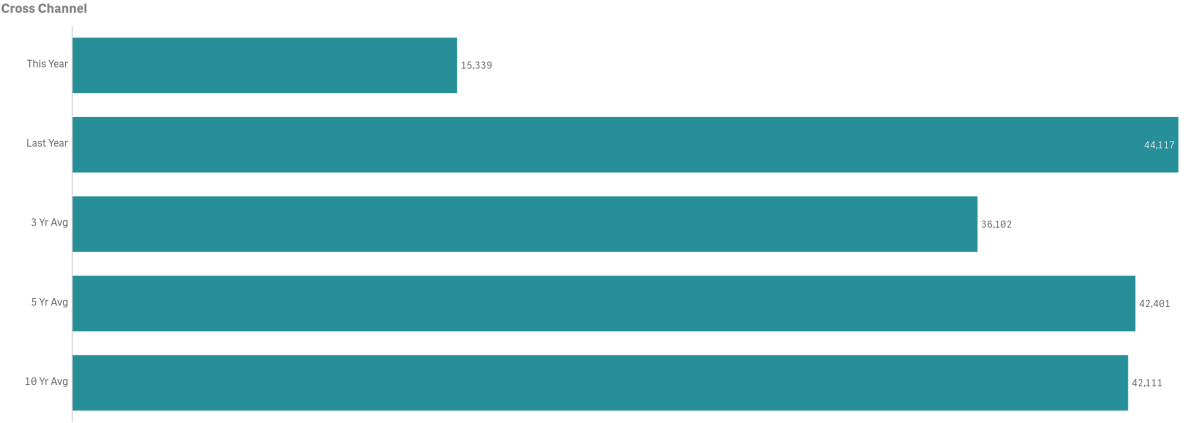
- March Cross Channel passenger counts were down 65.2% year-over-year @ 15,339
- 2015 had the highest volume for the month @ 53,981 passengers
- 2020 had the lowest volume for the month @ 15,339 passengers
- March Cross Channel passenger counts were below the three-year average of 36,102 by 57.5%
- Cross Channel Carriers made up 66.55% of total monthly arrivals
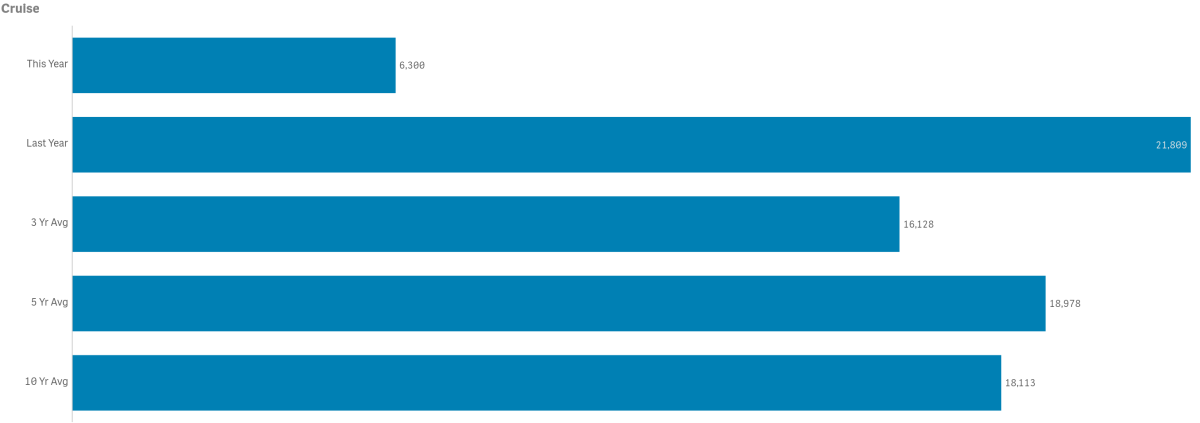
- Cruise passenger counts were down 71.1% year-over-year @ 6,300
- The number of Cruise Ships calling on Avalon was down @ 3 vs. 9 in 2019
- 2006 had the highest passenger volume for the month @ 28,362
- 1995 had the lowest passenger volume for the month @ 4,819
- March passenger counts were below the three-year average of 16,128 by 60.9%
- Cruise passengers made up 27.33% of total monthly arrivals
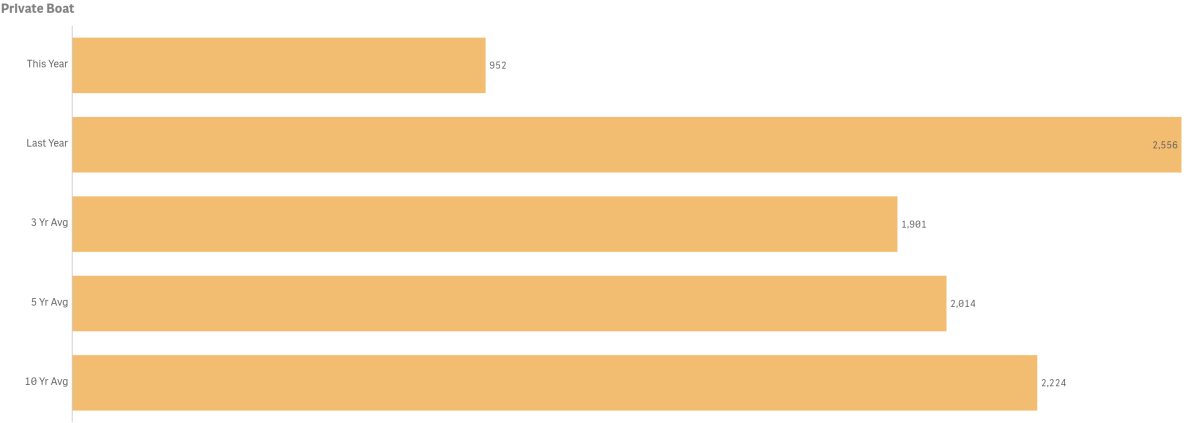
- Private Boater passenger counts were down year-over-year by 62.8% @ 952
- 2015 had the highest volume for the month @ 3,384
- 2020 had the lowest volume month @ 952
- March counts were below the three-year average of 1,901 by 49.9%
- March number of boats on anchors was down 38.29% @ 58
- March number of boats on moorings was down 62.75% @ 238
- Private Boaters Made up 4.11% of total monthly arrivals
.
Arrivals by Air
Avalon's combined in-bound air passenger counts for March totaled 482, down by 59.3% from 2019.
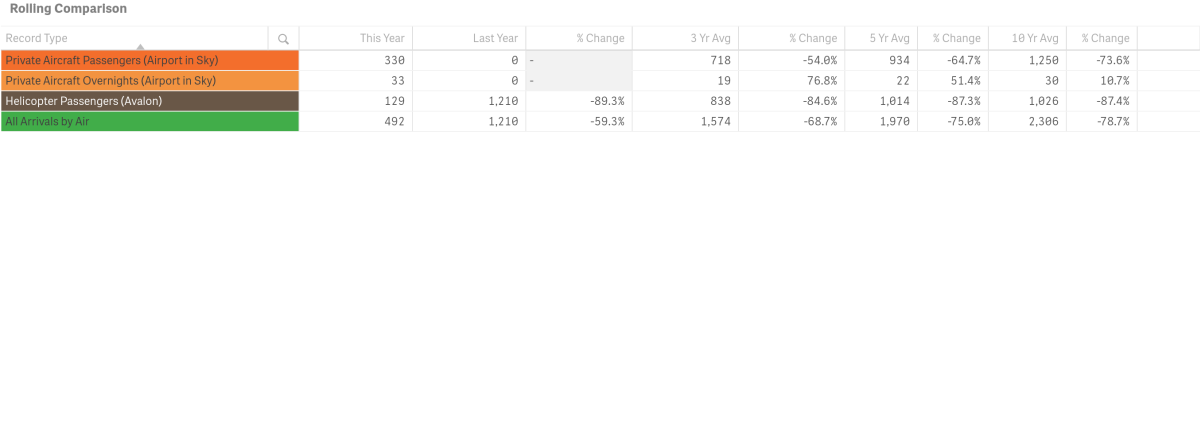
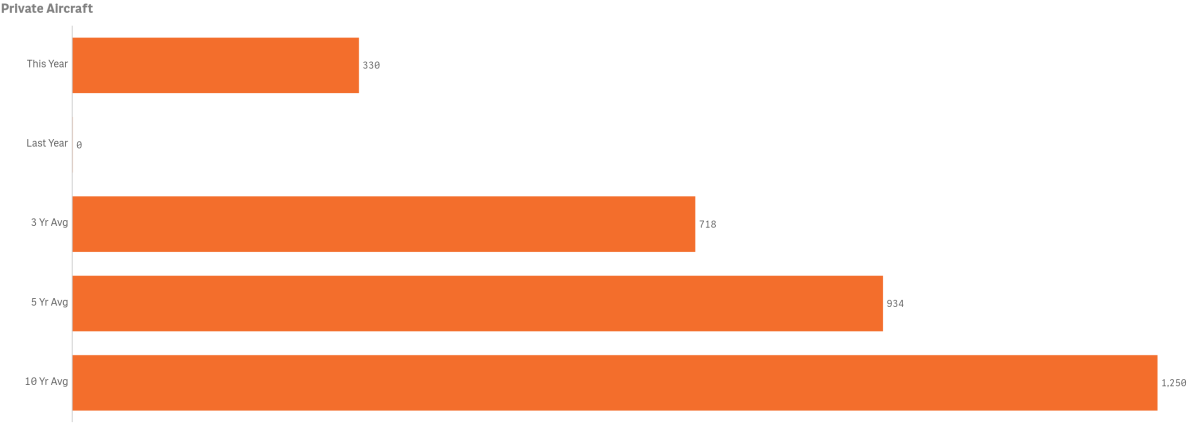
- People aboard planes (Airport in the Sky) was up 100% as the airport was closed last year for repairs
- March counts were below the three-year average of 718 by 54.8%
- 2018 had the highest volume for the month @ 1,823
- 2020 had the lowest volume month in which the airport was open @ 330
- March people aboard planes made up 3.11% of total monthly arrivals
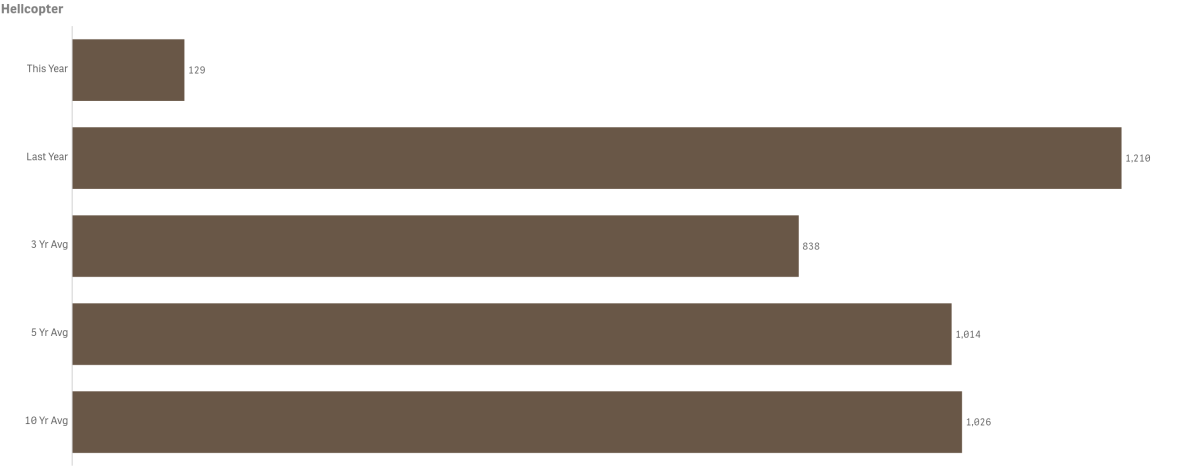
- People aboard Charter Helicopters was down year-over-year by 89.3% @ 129
- 2016 had the highest volume for the month @ 1,569
- 2020 had the lowest volume for the month @ 129
- March counts were below the three-year average of 838 by 84.6%
- March people aboard Helicopters made up 0.56% of total monthly arrivals
Year-to-Date

- Total arrivals year-to-date was down @ 132,077 or 18.1% over last year
- Total arrivals year-to-date fell below the three, five and ten year averages
To view historical data for total arrivals by sector, year and month in a spreadsheet form click here.
Weather
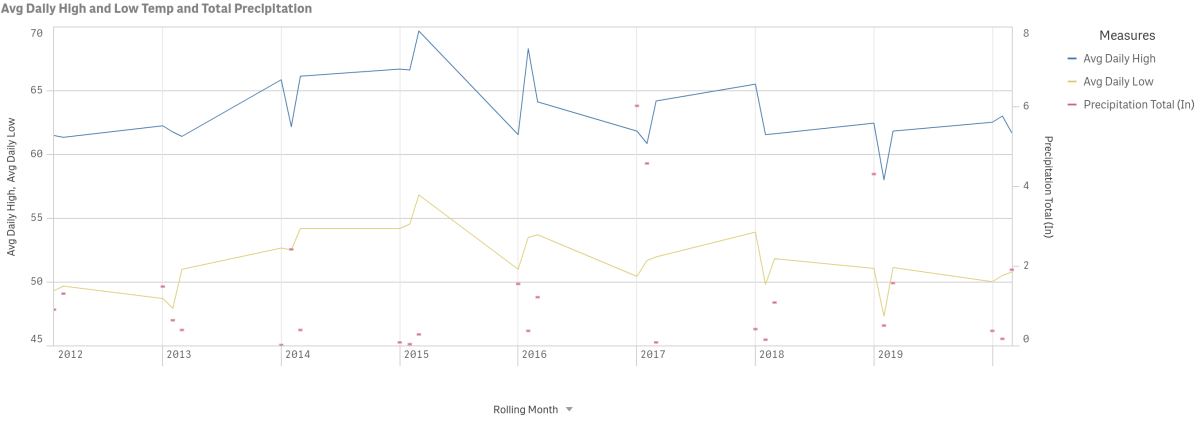
Year-over-year comparison for highs, lows and precipitation is charted below for the months of January-March each year back to 2012.
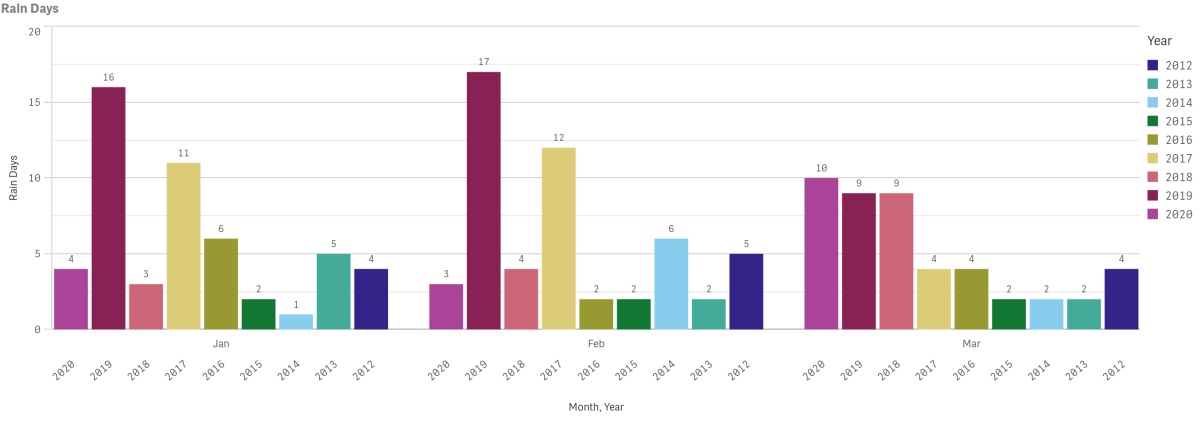
The number of rain days Year-to date is charted below with year-over year comparisons
Catalina Flyer from Newport
$10 Off Catalina Island Ferry
Hop onboard the Catalina Flyer for daily ferry service from Newport Beach to Avalon, Catalina Island in just over 1 hour.
Catalina Sea Spa
Recharge with massages starting at $110.
Discover Bliss at Catalina Sea Spa! Book online or call 310-510-8920. Treat yourself and escape to relaxation today!


