
July 2021
July continued to show significant signs of recovery from COVID-19 related closures.
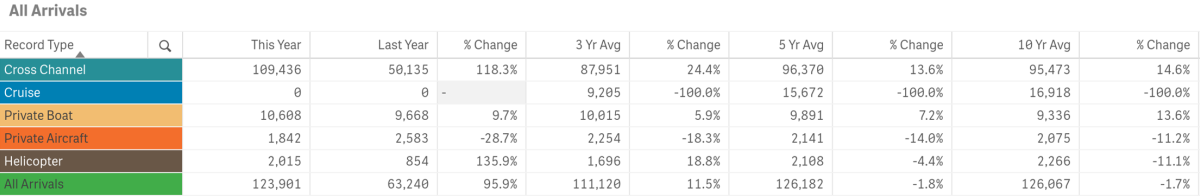
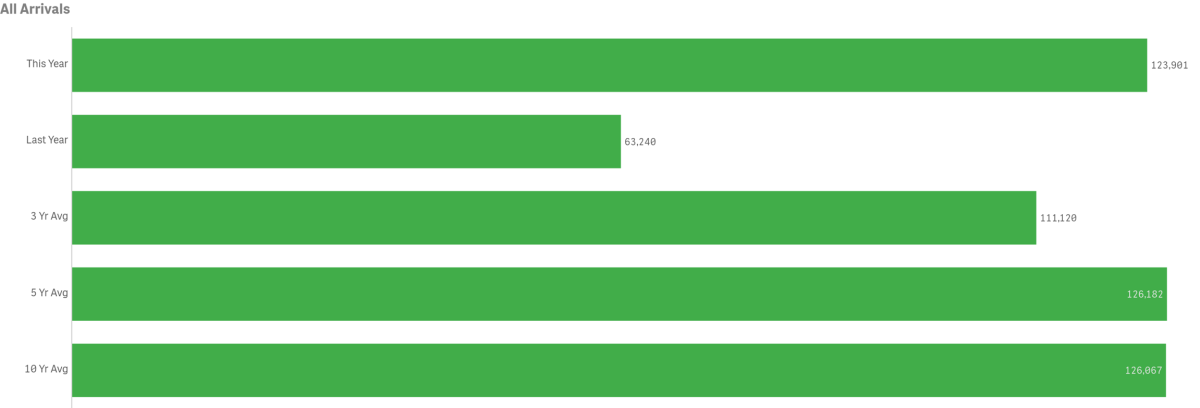
All Arrivals
July visitation increased year-over-year in all but two sectors, resulting in an overall increase by 95.9% or 60,661 visitors over the same month last year.
Previous July tracking (below) offers a comparison without COVID-19 impacts. July 2021’s total of 123,901 fell short of July 2019’s total arrivals of 146,219.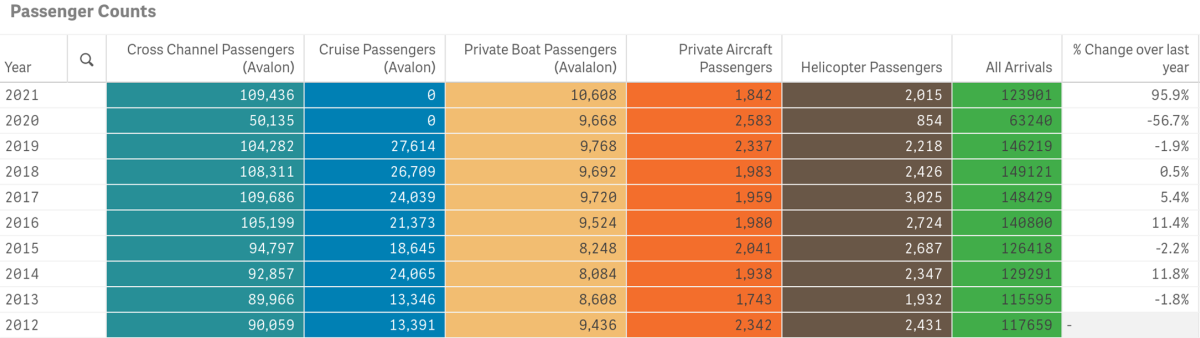
July’s total in-bound passengers = 123,901, up from last year @ 63,240. July 2021 was above the three year average but below five and ten-year averages. July 2021 trailed the same month in 2019 by 22,318 visitors.
Arrivals by Sea
Passengers arriving by sea, including private boaters, totaled 120,844 for the month of July, up by 61,041 from 59,803 last year.
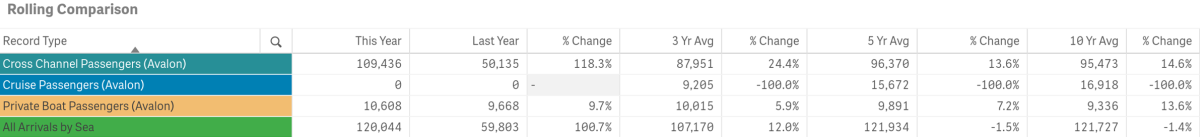
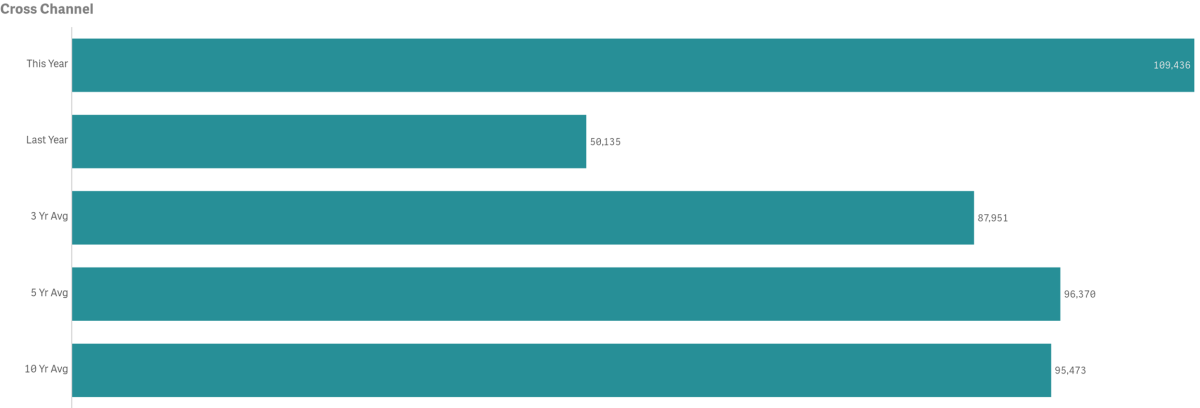
- July Cross Channel passenger counts were up year-over-year @ 109,436 vs. 50,135 last year
- 2000 had the highest volume for the month @ 117,097 passengers
- 2020 had the lowest volume for the month @ 50,135. Pre-COVID-19 the lowest count for the month was in 2009 @ 73,367
- 2019 had 104,282 Cross Channel passengers or 5,154 fewer passengers than 2021
- July Cross Channel passenger counts were above the three-year average of 87,591 by 24.4%
- July Cross Channel passenger counts were above the five-year and ten-year averages of 96,370 and 95,473 respectively
- Cross Channel Carriers made up 84.17% of total monthly arrivals
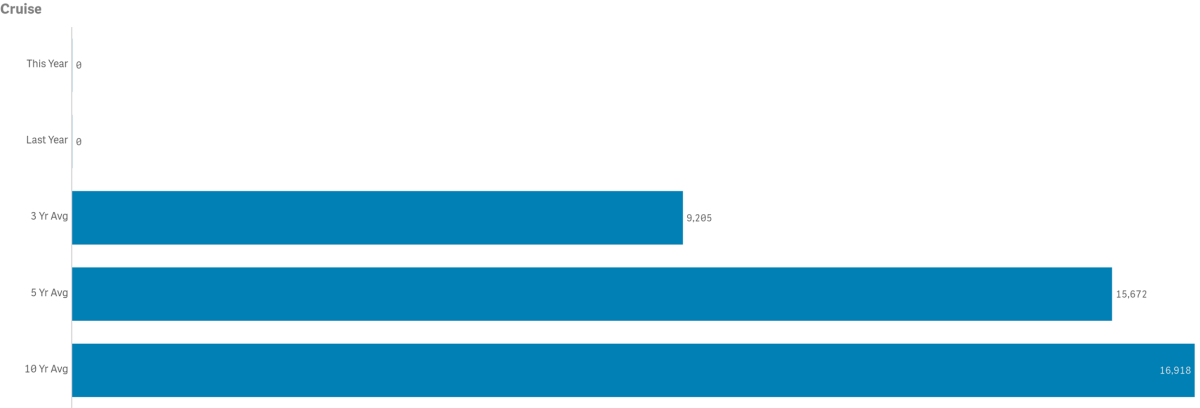
- Cruise passenger counts were 0 for the second year
- 2019 had the highest Cruise passenger volume for the month @ 27,614
- 2021 tied with 2020 as the lowest Cruise passenger volume for the month @ 0. Previous low was 2010 @ 10.512
- July Cruise passenger counts were below the three-year average of 9,205 (includes two years of 0 passengers)
- July Cruise passengers counts were below the five-year and ten-year averages of 15,672 and 16,918 respectively (includes two years of 0 passengers)
- Cruise passengers made up 0% of total monthly arrivals
- The number of Cruise Ships calling on Avalon was 0
- 2019 had 10 ships in July, with prior years typically having 9
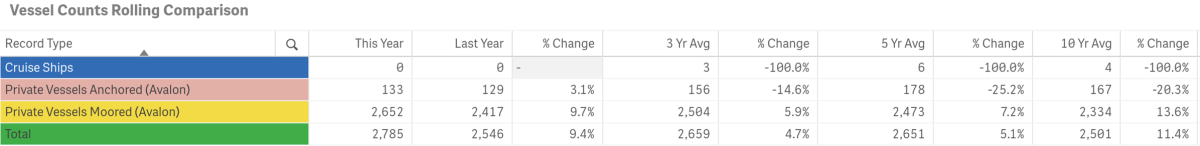
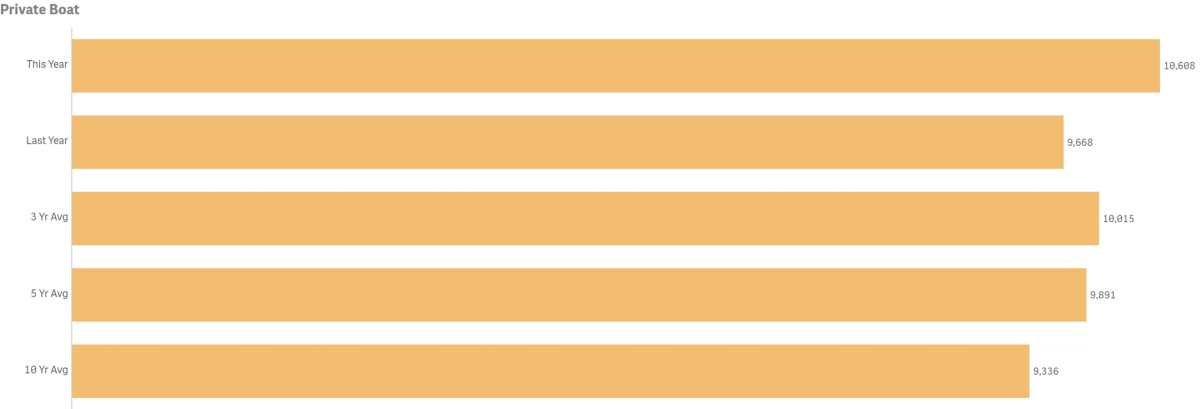
- Private Boater passenger counts were up year-over-year by 940 @ 10,608
- 2021 had the highest passenger volume for the month @ 10,608
- 2014 had the lowest passenger volume month @ 8,084
- July private boater passenger counts were above the three-year average of 10,015 by 9.7%
- July private boater passenger counts were above the five-year and ten-year average of 9,891 and 9,336 respectively
- July’s number of boats on anchor was up by 3.1% @ 133 vs.129 last year
- 2018 had the highest number of vessels anchored @ 213
- 2020 had the lowest number of vessels anchored @ 129
- July’s number of boats on moorings was up 9.7% @ 2,652 vs. 2,417 last year
- 2021 had the highest number of vessels on moorings @ 2,652
- 2014 had the lowest number of vessels on moorings @ 2,021
- Private Boaters Made up 8.56% of total monthly arrivals
Arrivals by Air
Combined in-bound air passenger counts for July totaled 3,934, up from 3,607 in 2020.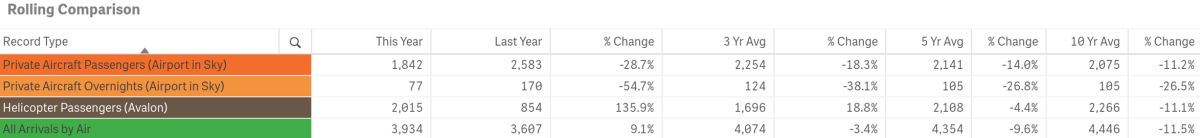
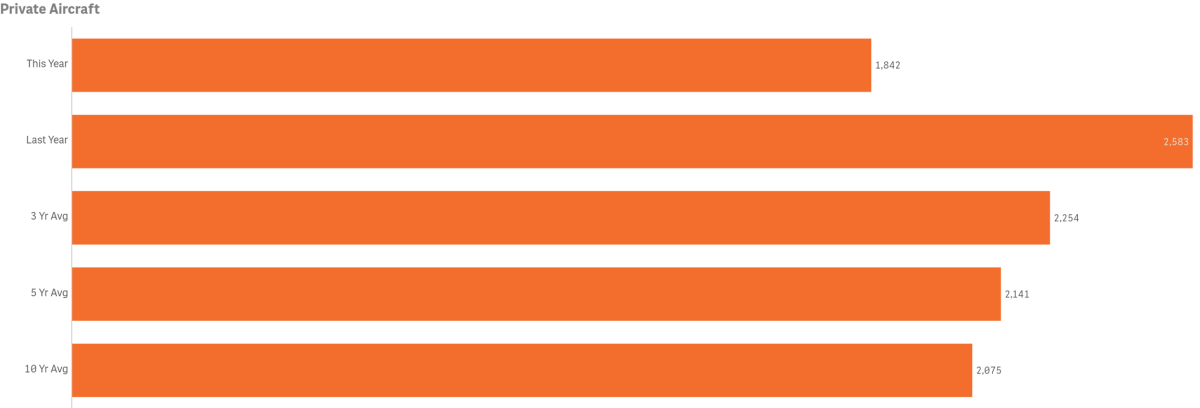
- People aboard planes (Airport in the Sky) was down @ 1,842 from 2,583 last year
- 2020 had the highest volume of private aircraft passengers for the month
- 2014 had the lowest volume of private aircraft passengers for the month @1.455.
- July counts for people aboard planes was below the three-year average of 2,254 by 18.3%
- July counts for people aboard planes was below the five-year and ten-year averages of 2,141 and 2,075 respectively
- July people aboard planes made up 1.5% of total monthly arrivals
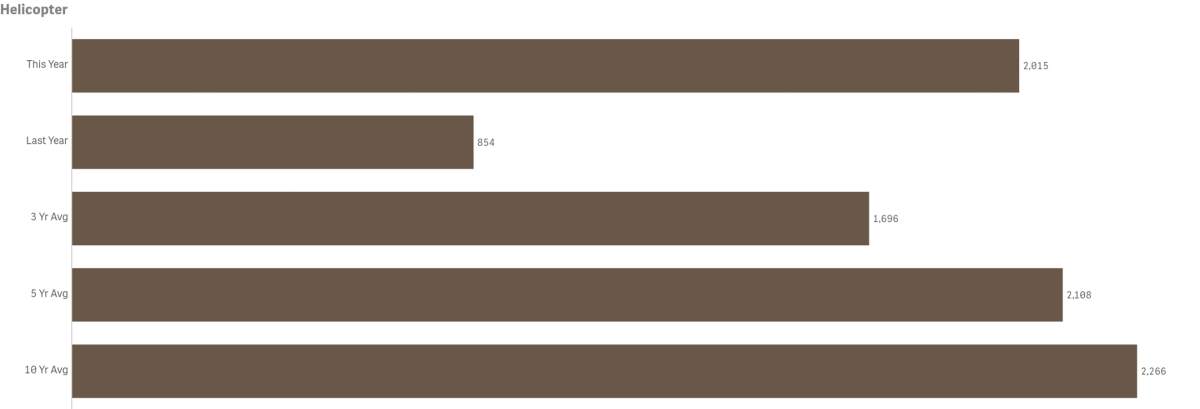
- People aboard Charter Helicopters was up year-over-year @ 2,016 vs. 854
- 2017 had the highest volume for the month @3,025
- 2020 had the lowest volume for the month @ 854. Previous low for month was 1,767 in 2009
- July counts for people aboard helicopters was above the three-year average of 1,696 by 18.8%
- July counts for people aboard helicopters was above the five-year and ten-year averages by 2,108 and 2,206 respectively
- July people aboard Helicopters made up 1.63% of total monthly arrivals
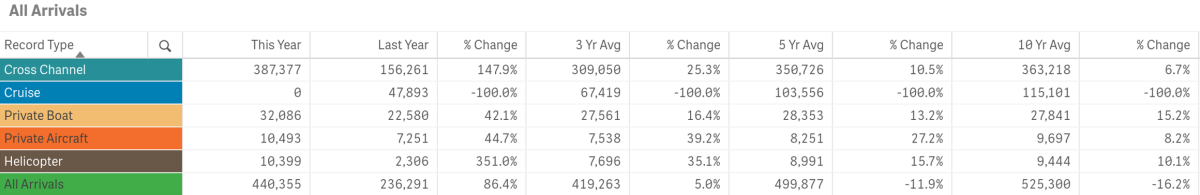
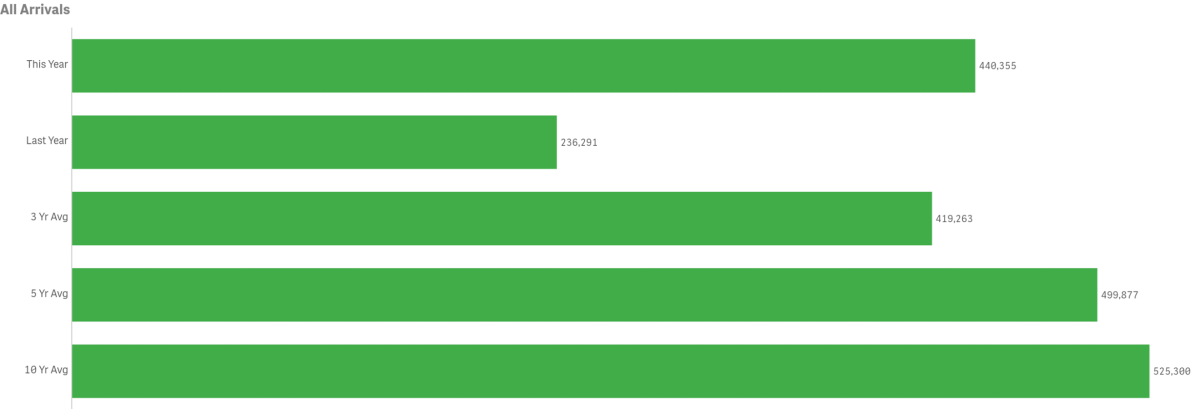
Year-to-Date
Total year-to-date arrivals are up from last year by 86%
- Total Arrivals year-to-date was up from last year @ 440,355 vs. 236,291 or a difference of 204,064 visitors
- Total Arrivals year-to-date exceeded the three-year average of 419,263
- Total Arrivals year-to-date were below the five and ten year averages of 499,877 and 525,300 respectively
- All arrival sectors are up year-to-date with the exception of Cruise
Year-to-Date--Historical
Pre-Covid-19 comparison data is illustrated below.
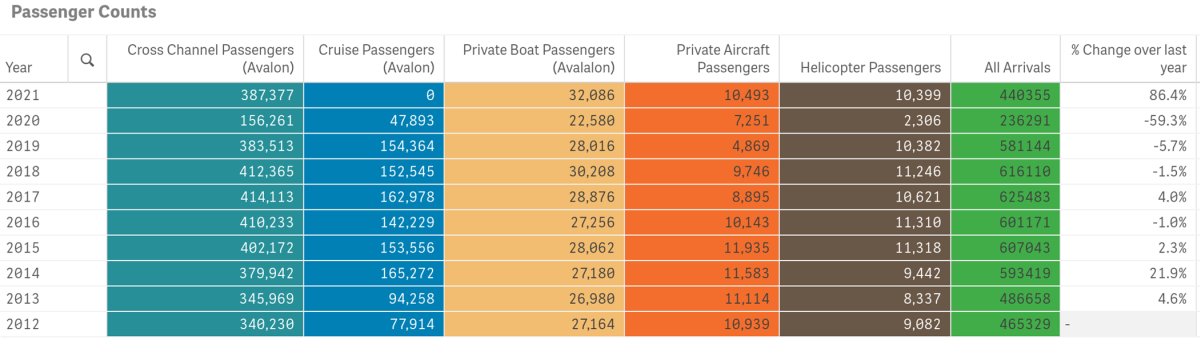
- 2017 had the highest total visitation year-to-date @ 625,483
- Compared to 2017, year-to-date total arrivals are down by 185,128
- 2019 had 581,184 visitors year-to-date
- Compared to 2019, year-to-date total arrivals are down by 140,789 people
- Cruise arrivals are down year-to-date compared to 2019 while Cross Channel, Private Boat, Private Aircraft and Helicopter arrivals are up.
To view historical data for total arrivals by sector, year and month in a spreadsheet form click here. PDF File.
Visitor Services
July Visitor Services increased year-over-year in all measures.
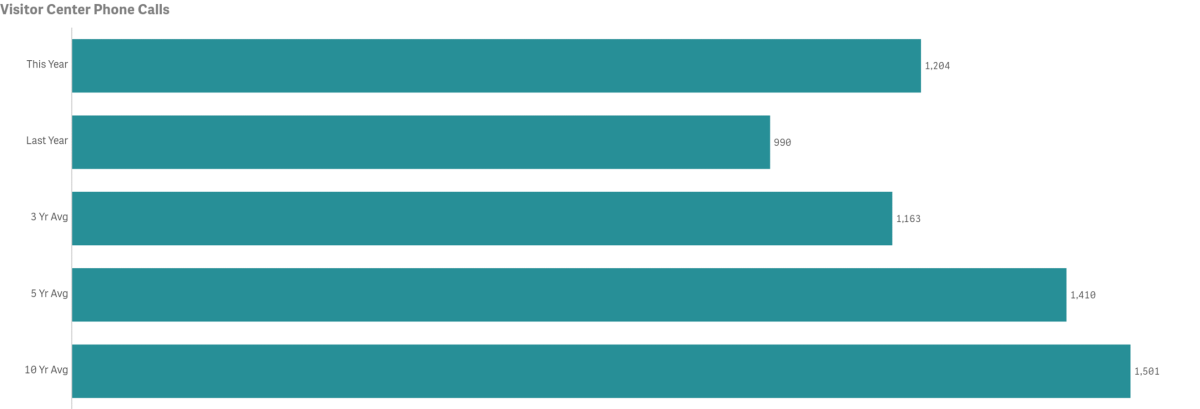
Catalina Island Visitor Center

- Number of calls for the month was up year-over-year by 21.6% @ 1,204 vs. 990
- 2008 had the highest volume for the month @ 3,101 calls
- 2020 had the lowest volume for the month @ 990 calls
- July call counts were above the three-year average of 1,163 by 3.5%
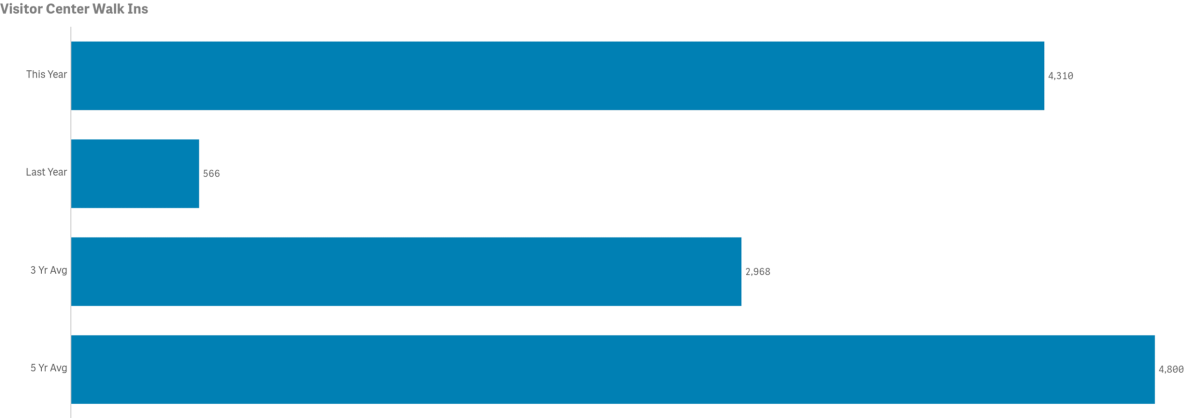
- Number of Walk-Ins for the month was up year-over-year @ 4,310 vs. 566
- 2018 had the highest volume of walk-ins for the month @ 8,413 guests
- 2020 had the lowest volume of walk-ins for the month @ 566 guests
- July Walk-In counts were above the three-year average of 2,968 by 45.2%
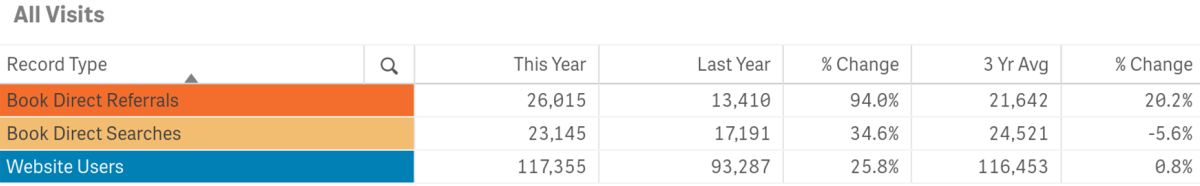
LoveCatalina.com
All figures below are for the month of July 2021
LoveCatalina.com website users totaled 117,355 vs. 93,287 in 2020
Book Direct lodging searches 23,145 vs. 17,191 in 2020
Book Direct referrals 26,015 vs. 13,410 in 2020
Printed Visitor Guide orders @ LoveCatalina.com @ 53
Online Guide downloads @ 634
E-blast consumer new subscribers @ 155
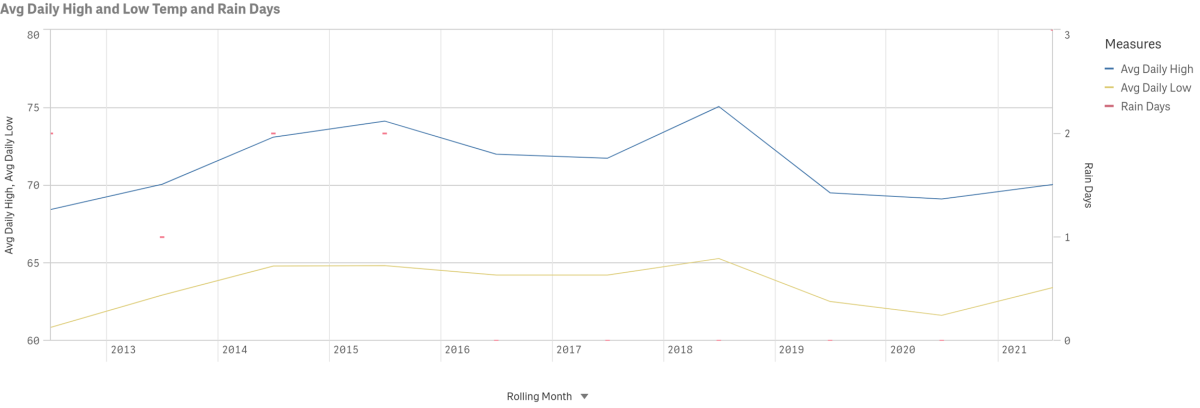
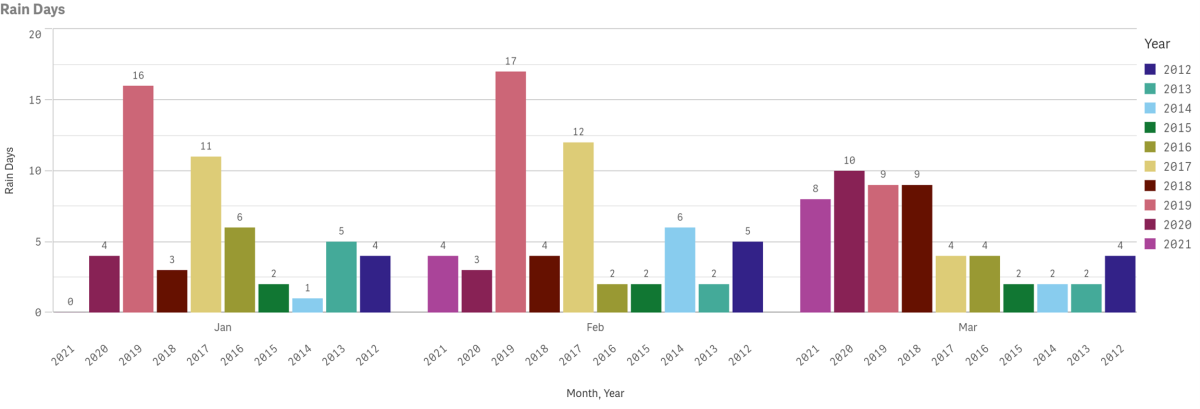
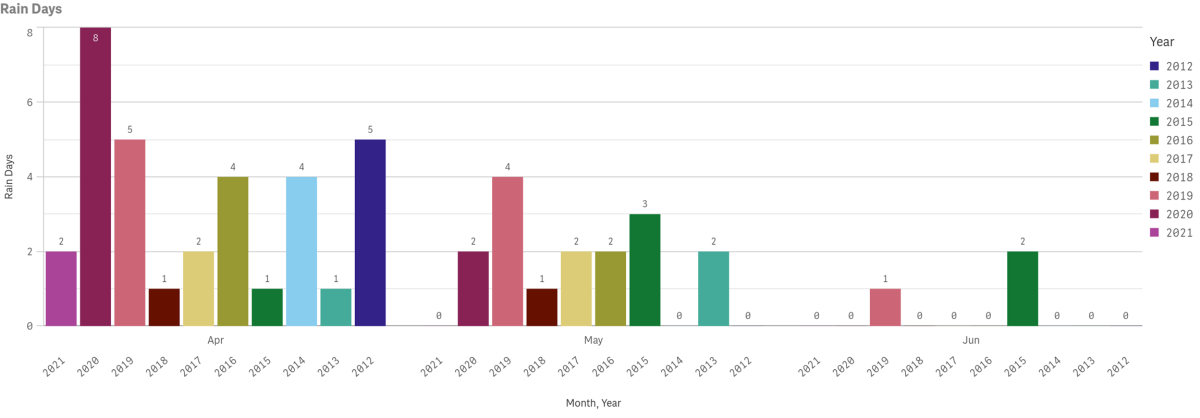
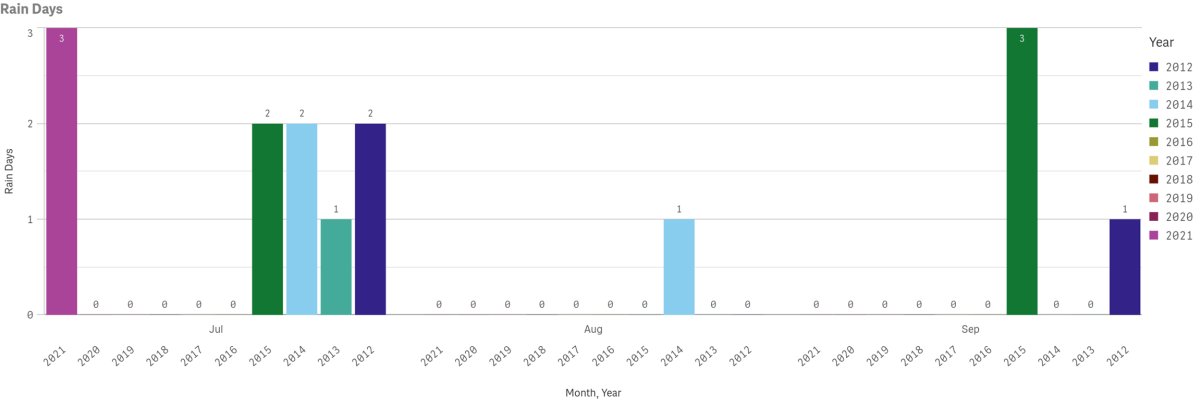
Weather
Data for July highs, lows and precipitation going back to 2012 is displayed below. Multi-year rain days data is also displayed by year and month. Measures are taken at Avalon Harbor.


Catalina Flyer from Newport
$10 Off Catalina Island Ferry
Hop onboard the Catalina Flyer for daily ferry service from Newport Beach to Avalon, Catalina Island in just over 1 hour.

Catalina Sea Spa
Recharge with massages starting at $110.
Discover Bliss at Catalina Sea Spa! Book online or call 310-510-8920. Treat yourself and escape to relaxation today!

