
August 2020
August 2020, much like July was greatly impacted by COVID-19, though far less than the months of March – June. August saw significant growth over prior months of the year.
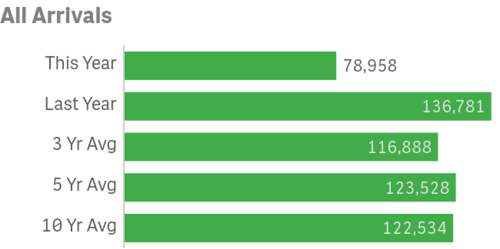
All Arrivals
August visitation decreased year-over-year in all sectors, resulting in a total decrease of 42.3% in passengers over the same month last year.

August’s total in-bound passengers = 78,958, down 42.3% from last year @ 136,781. August 2020 was below the three-year average of 116,888 by 32.5%. August was below the five-year average of 123,528 by 32.5% and the ten-year average of 122,534 by 35.6%.
Arrivals by Sea
People arriving by sea, including private boaters, was 75,015 for the month of August, down 43.2% from 132,053 last year.
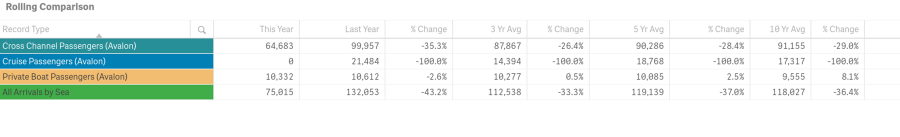
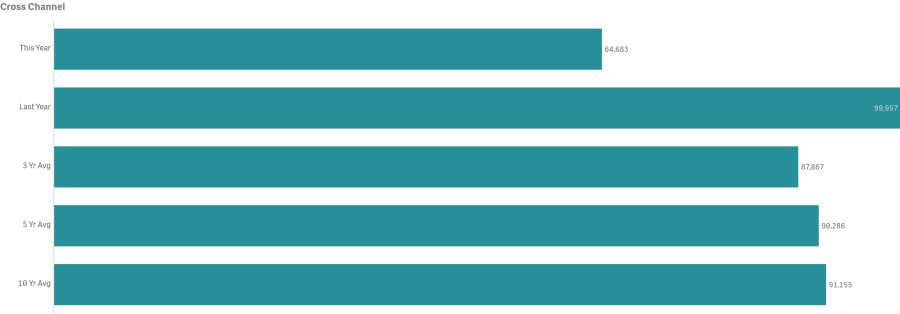
- August Cross Channel passenger counts were down 35.3% year-over-year @ 64,683
- 1990 had the highest volume for the month @ 121,064 passengers
- 2020 had the lowest volume for the month @ 64,683 passengers
- August Cross Channel passenger counts were below the three-year average of 87,867 by 26.4%
- Cross Channel Carriers made up 81.92% of total monthly arrivals
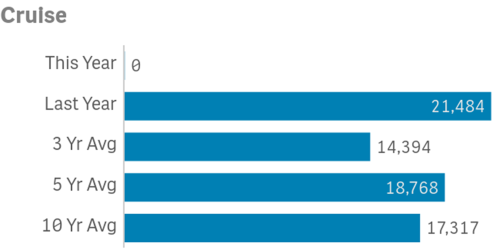
- Cruise passenger counts were down 100% year-over-year @ 0
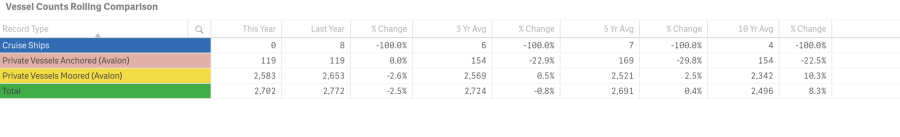
- The number of Cruise Ships calling on Avalon was down @ 0 vs. 8 in 2019
- 2016 had the highest passenger volume for the month @ 26,326
- 2020 had the lowest passenger volume for the month @ 0
- July passenger counts were below the three-year average of 14,394 by 100%
- Cruise passengers made up 0% of total monthly arrivals
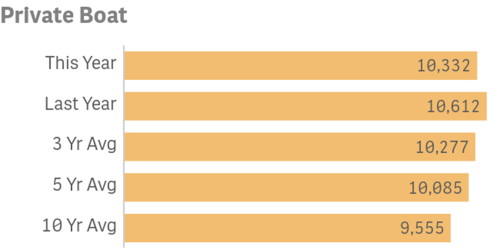
- Private Boater passenger counts were down year-over-year by 2.6% @ 10,332
- 2019 had the highest volume for the month @ 10,612
- 2015 had the lowest volume month @ 8,424
- August passenger counts were below the three-year average of 10,277 by 0.5%
- August number of boats on anchors was even with last year @ 119
- August number of boats on moorings was down 2.6% @ 2,583
- Private Boaters Made up 15.29% of total monthly arrivals
Arrivals by Air
Combined in-bound air passenger counts for August totaled 4,035, down by 16% from 2019.
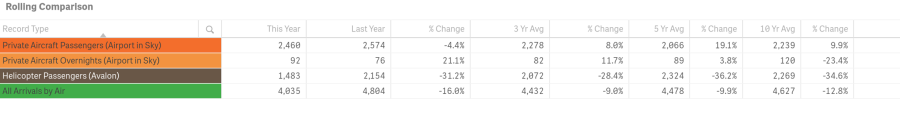
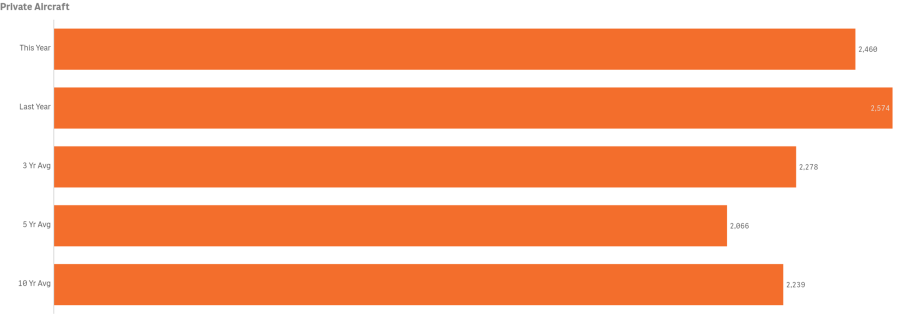
- People aboard planes (Airport in the Sky) was down 4.4% from 2,574 in 2019
- 2008 had the highest volume of private aircraft passenger counts for the month @ 2,694
- 2018 had the lowest volume of private aircraft passenger counts for the month @ 1,800
- August counts were above the three-year average of 2,278 by 8%
- August people aboard planes made up 3.12% of total monthly arrivals
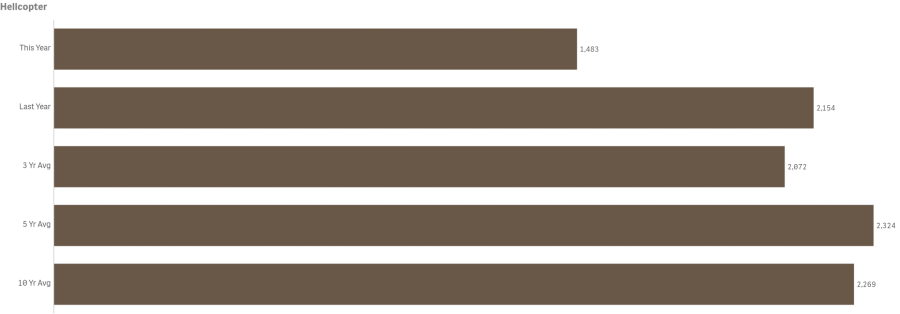
- People aboard Charter Helicopters was down year-over-year by 31.2% @ 1,483
- 2017 had the highest volume for the month @ 2,683
- 2020 had the lowest volume for the month @ 1,483
- August counts were below the three-year average of 2,072 by 28.4%
- August people aboard Helicopters made up 1.88% of total monthly arrivals
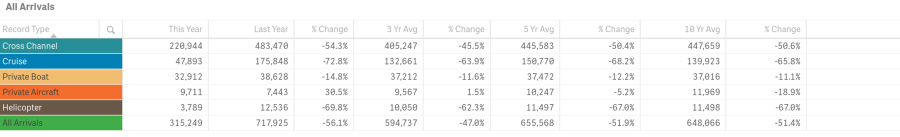
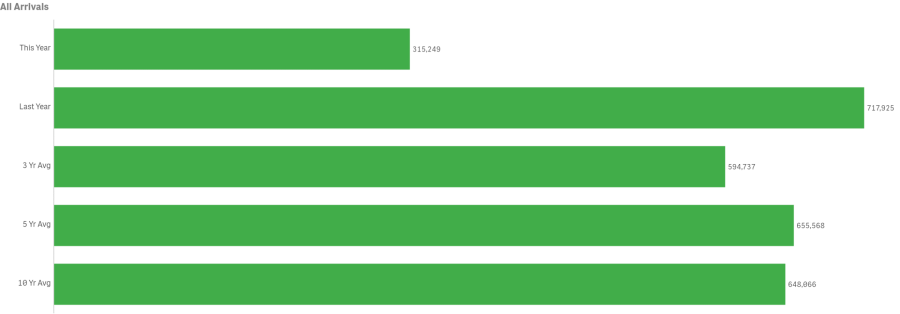
- Total arrivals year-to-date was down 56.1% from last year @ 315,249 or -402,676 visitors
- Total arrivals year-to-date fell below the three, five and ten year averages
To view historical data for total arrivals by sector, year and month in a spreadsheet form click here.
Weather
Year-over-year comparison for highs, lows and precipitation is charted below for the month of August each year back to 2012.
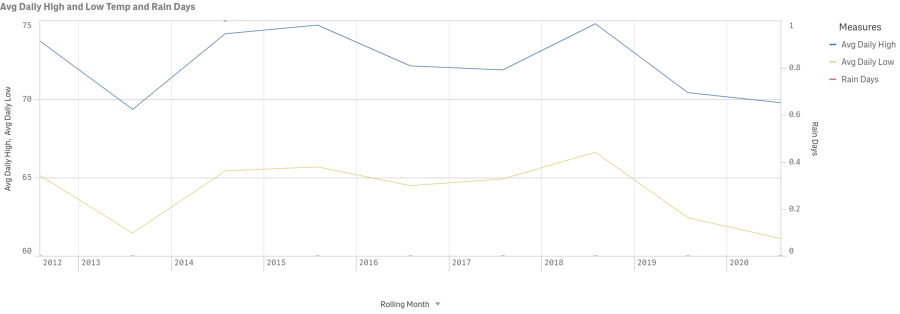
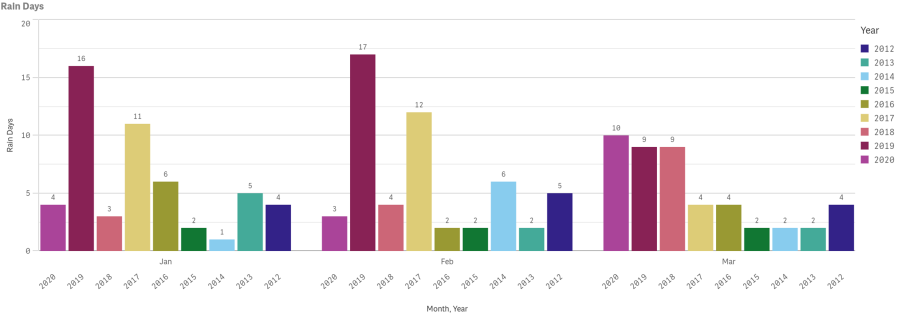
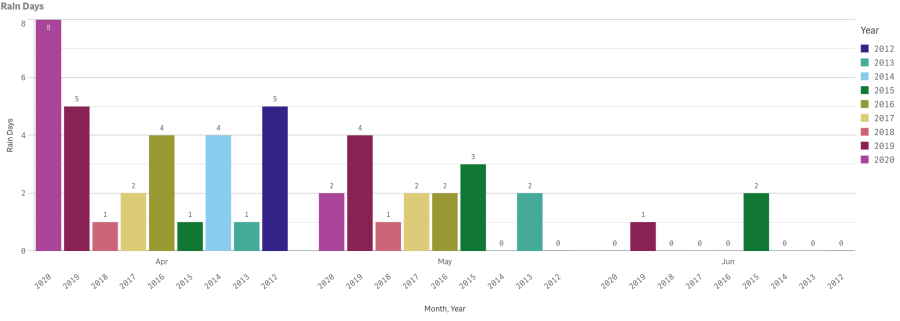
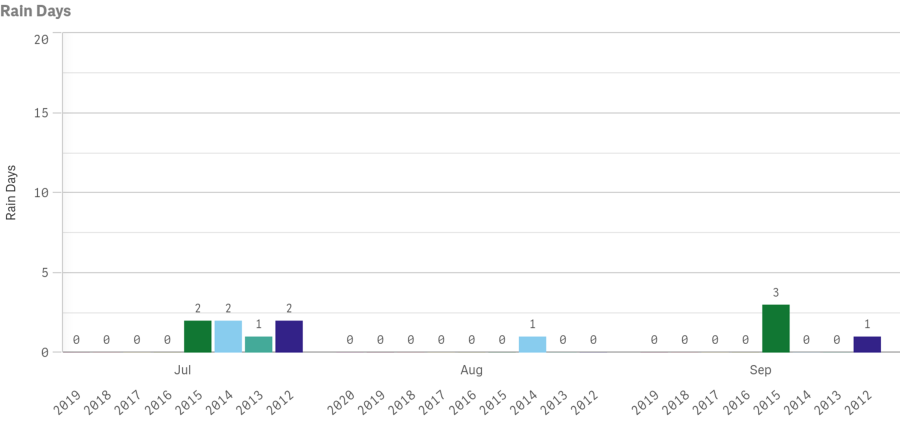
The number of rain days Year-to date is charted below with year-over year comparisons.


51st Annual New Year’s Eve Gala Celebration
Reservations are On Sale!
A sparkling night of evening gowns, tuxedos, champagne, dining and dancing on Tuesday, December 31 in the world-famous Casino Ballroom.


