
November 2020
November 2020, reflected the ongoing impacts of COVID-19 far less than did the months of March – June. Thanksgiving travel was greatly reduced due to COVID-19 restrictions on outdoor dining.
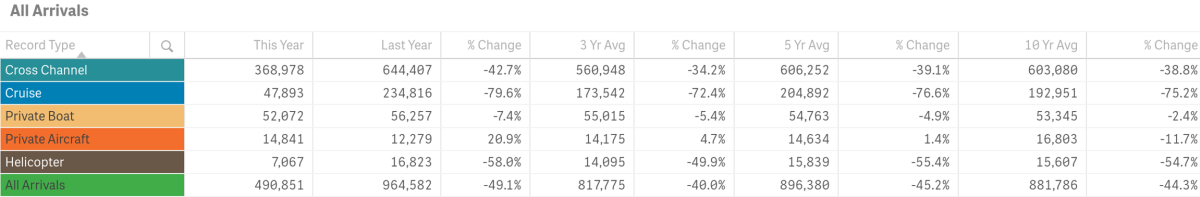
All Arrivals
November visitation decreased year-over-year in four sectors (cross channel, cruise, private boaters and helicopter), resulting in an overall decrease by 33,346 visitors over the same month last year.
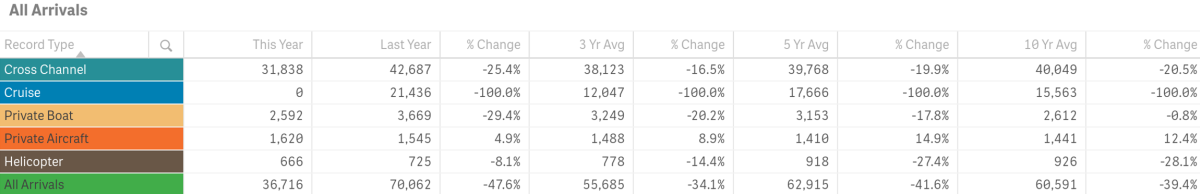
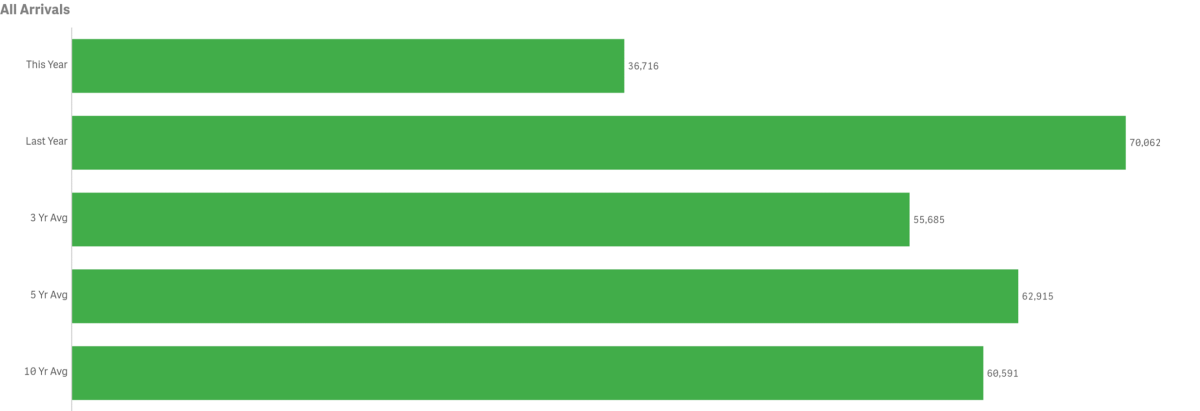
November’s total in-bound passengers = 36,716, down 47.6% from last year @ 70,062. November 2020 was below the three-year average of 55,685 by 34.1%. November was below the five-year average of 62,915 by 41.6% and the ten-year average of 60,591 by 39.4%.
Arrivals by Sea
Passengers arriving by sea, including private boaters, was 65,119 for the month of November, down 49.2% @ 34,430 from 87,792 last year.
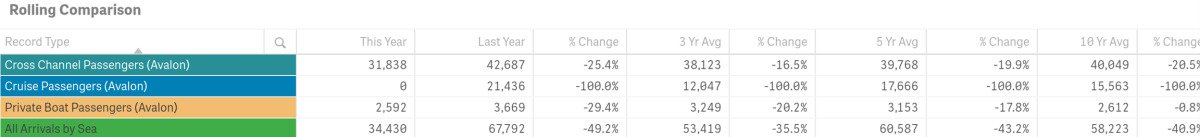
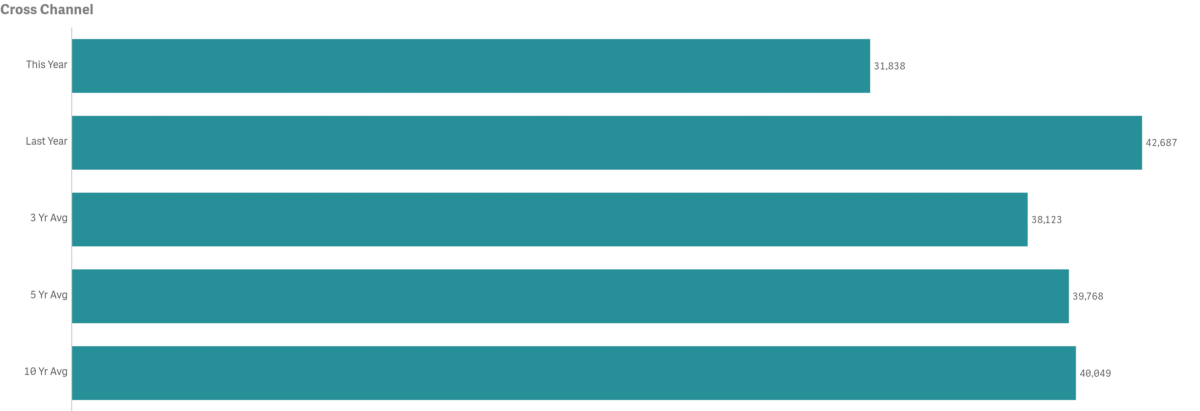
- November Cross Channel passenger counts were down 25.4% year-over-year @ 31,838
- 2014 had the highest volume for the month @ 50,948 passengers
- 2009 had the lowest volume for the month @ 24,262 passengers
- November Cross Channel passenger counts were below the three-year average of 38,123 by 16.5%
- Cross Channel Carriers made up 86.71% of total monthly arrivals
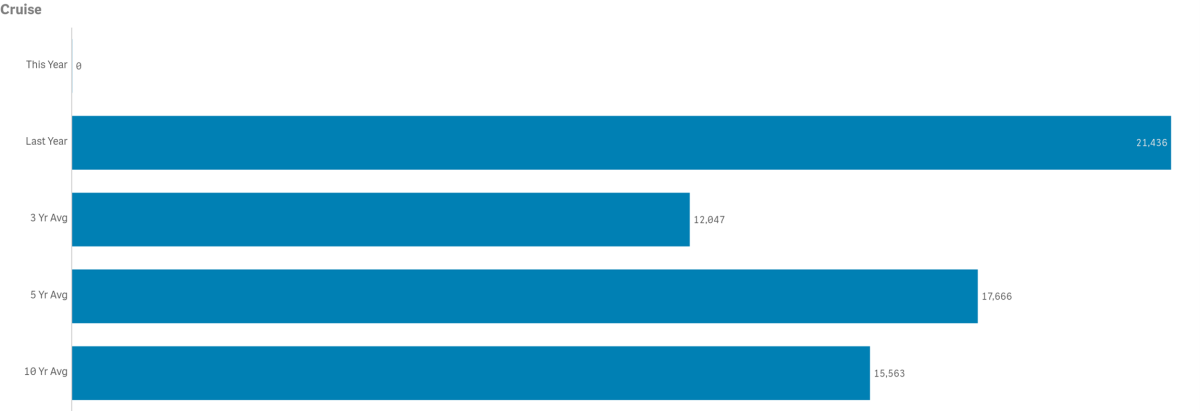
- Cruise passenger counts were down 100% year-over-year @ 0
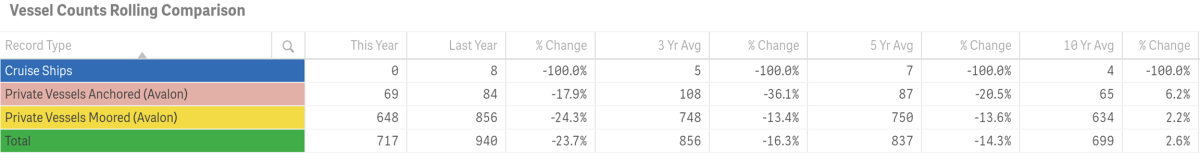
- The number of Cruise Ships calling on Avalon was down @ 0 vs. 8 in 2019
- 2016 and 2017 had the highest number of cruise ships in port @ 11 each
- 2020 had the lowest number of cruise ships in port @ 0
- 2015 had the highest cruise ship passenger volume for the month @ 29,084
- 2020 had the lowest cruise ship passenger volume for the month @ 0
- November cruise passenger counts were below the three-year average of 12,047 by 100%
- Cruise passengers made up 0% of total monthly arrivals
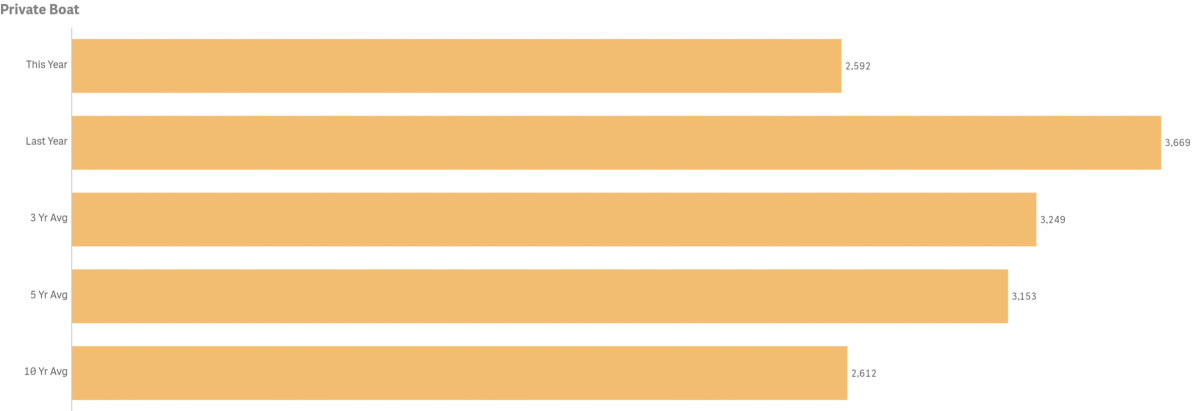
- Private Boater passenger counts were down year-over-year by 29.4% @ 2,592
- 2019 had the highest volume for the month @ 3,669
- 2015 had the lowest volume month @ 2,312
- November private boater passenger counts were below the three-year average of 3,249 by 20.2%
- November number of boats on anchor was down 17.9% from last year @ 69
- 2018 had the highest number of vessels at anchor @ 171
- 2011 and 2012 had the lowest number of vessels at anchor @ 4 each
- November number of boats on moorings was down 24.3% @ 648
- 2019 had the highest number of vessels on moorings @ 856
- 2015 had the lowest number of vessels on moorings @ 578
- Private Boaters Made up 7.06% of total monthly arrivals
Arrivals by Air
Combined in-bound air passenger counts for November totaled 2,324, up by 0.5% from 2019.
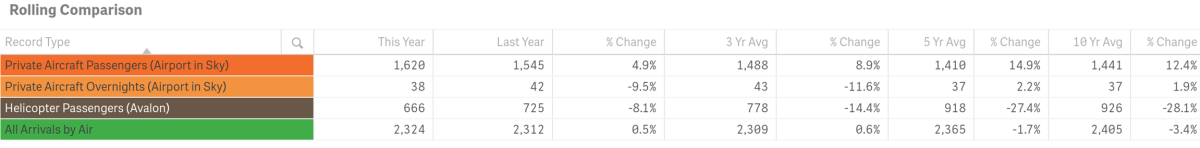
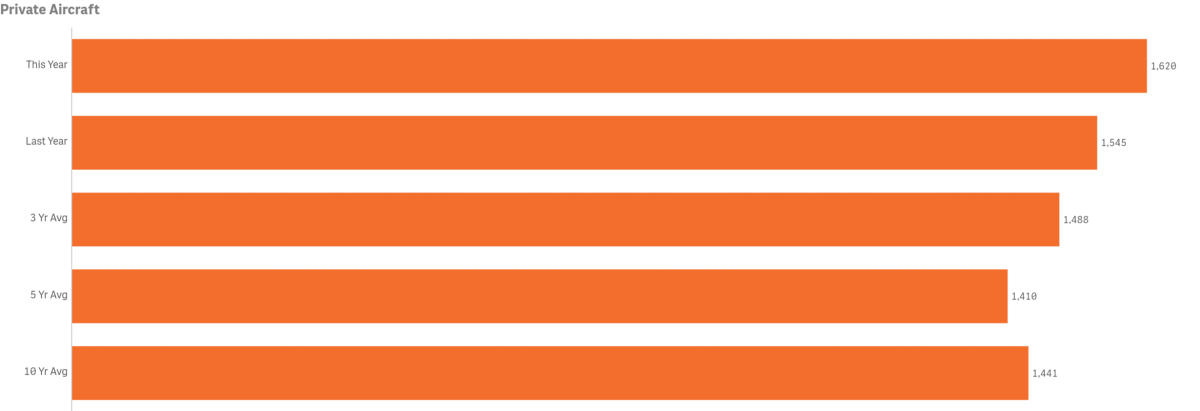
- People aboard planes (Airport in the Sky) was up 4.9% @ 1,620
- 2015 had the highest volume of private aircraft passenger counts for the month @ 1,773
- 2007 had the lowest volume of private aircraft passenger counts for the month @ 1,079
- November counts for people aboard planes was above the three-year average of 1,488 by 8.9%
- November people aboard planes made up 4.41% of total monthly arrivals
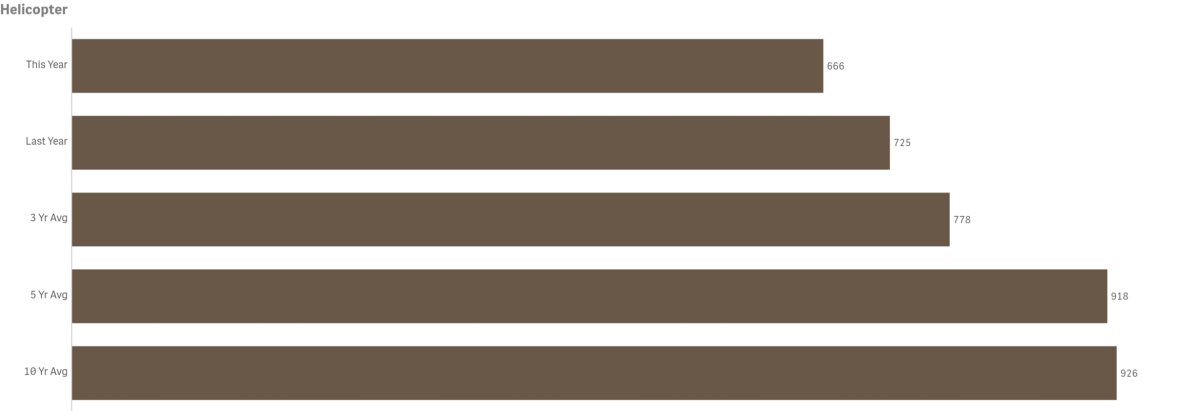
- People aboard Charter Helicopters was down year-over-year by 8.1% @ 666
- 2017 had the highest volume for the month @ 1,164
- 2011 had the lowest volume for the month @ 623
- November counts were below the three-year average of 778 by 14.4%
- November people aboard Helicopters made up 1.81% of total monthly arrivals
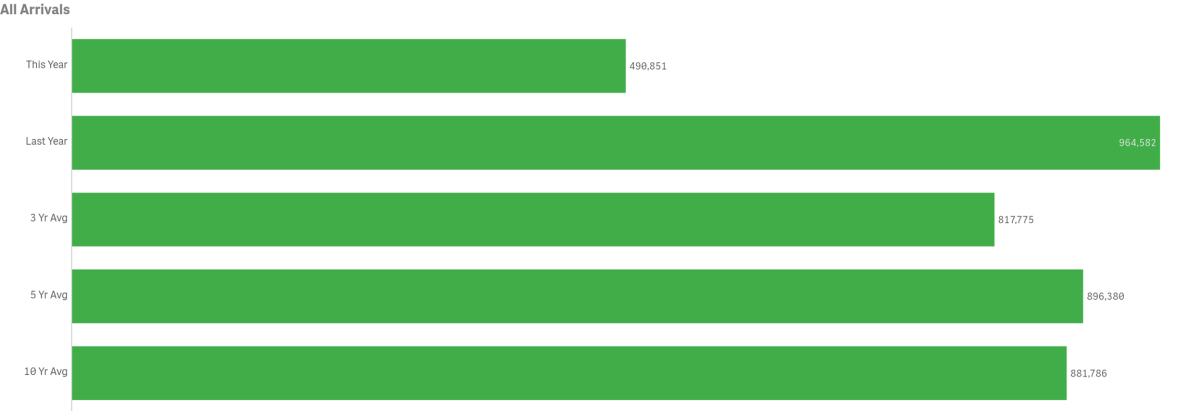
Year-to-Date
- Total arrivals calendar year-to-date was down 49.1% from last year @ 490,851 visitors
- Total arrivals calendar year-to-date fell below the three, five and ten year averages by over 40% each
To view historical data for total arrivals by sector, year and month in a spreadsheet form click here.
Weather
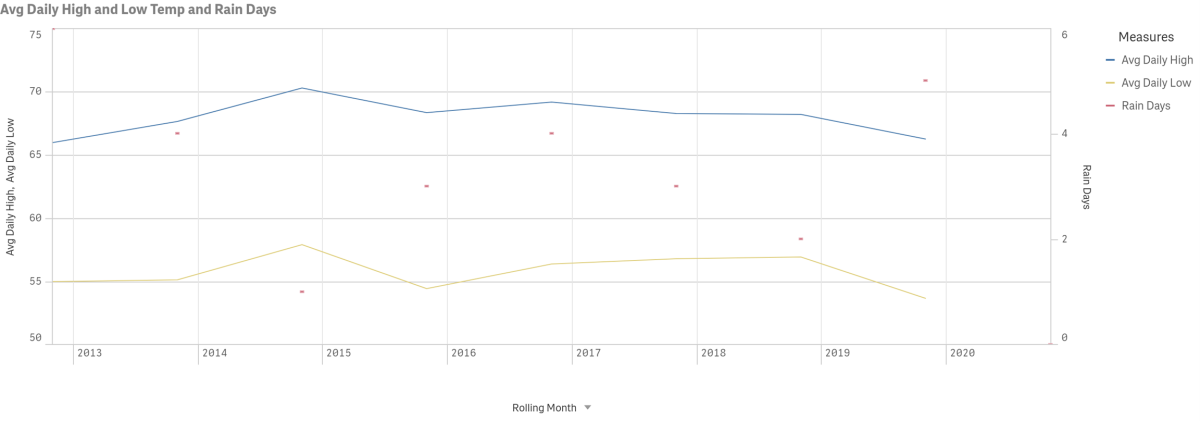
Year-over-year comparison for highs, lows and precipitation is charted below for the month of November each year back to 2012.
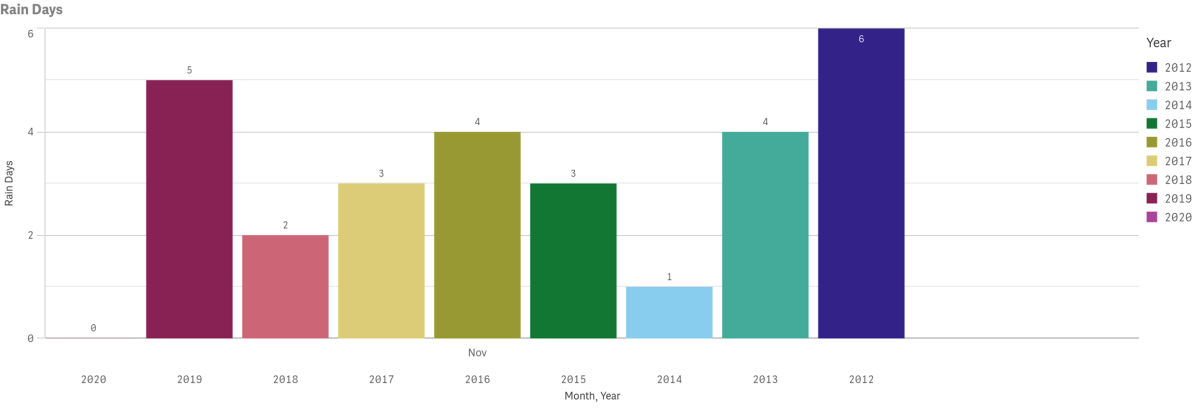
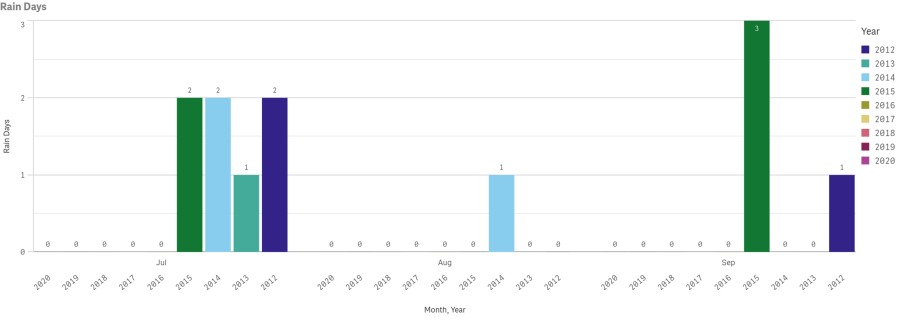
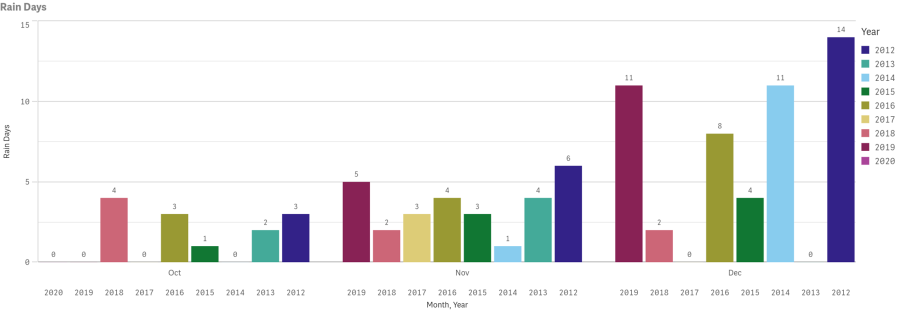
Year-over-year comparison for rain days is charted below for the month of November each year back to 2012.
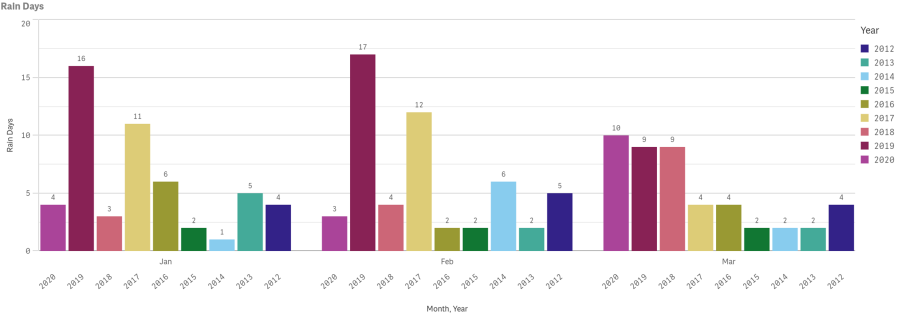
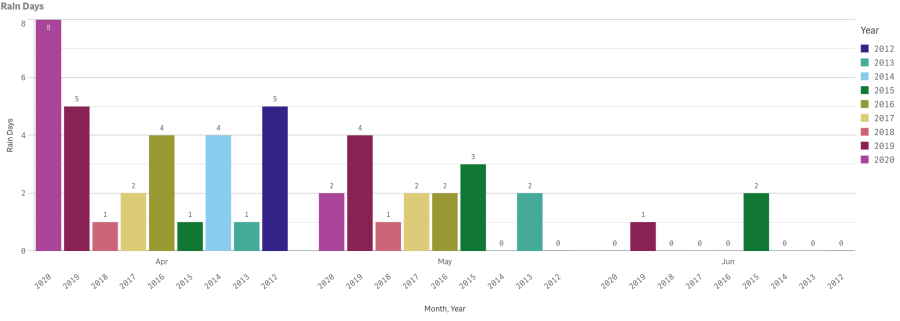
The number of rain days Year-to date is charted below with year-over year comparisons.


51st Annual New Year’s Eve Gala Celebration
Reservations are On Sale!
A sparkling night of evening gowns, tuxedos, champagne, dining and dancing on Tuesday, December 31 in the world-famous Casino Ballroom.


