February 2021
February 2021, reflected the ongoing impacts of COVID-19. February 2020 was the last month of “normal” operations prior to COVID-19 based limitations on travel. February 2020 exceeded the typical visitor counts for the month.
All Arrivals
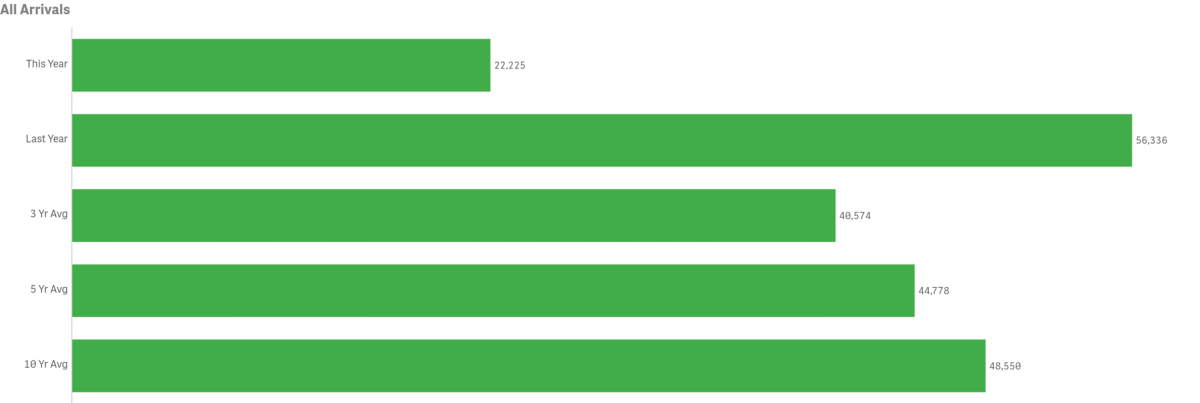
February visitation decreased year-over-year in three sectors (cross channel, cruise and private boaters), resulting in an overall decrease by 34,111 visitors over the same month last year. Note that last year Helicopter services were temporarily paused.

February’s total in-bound passengers = 22,225, down 60.5% from last year @ 56,336. February 2021 was below the three-year average of 40,547 by 45.2%. February was below the five-year average of 44,778 by 50.4% and the ten-year average of 48,550 by 54.2%.
Arrivals by Sea
Passengers arriving by sea, including private boaters, was 20,133 for the month of February, down 63.4% from 55,070 last year.


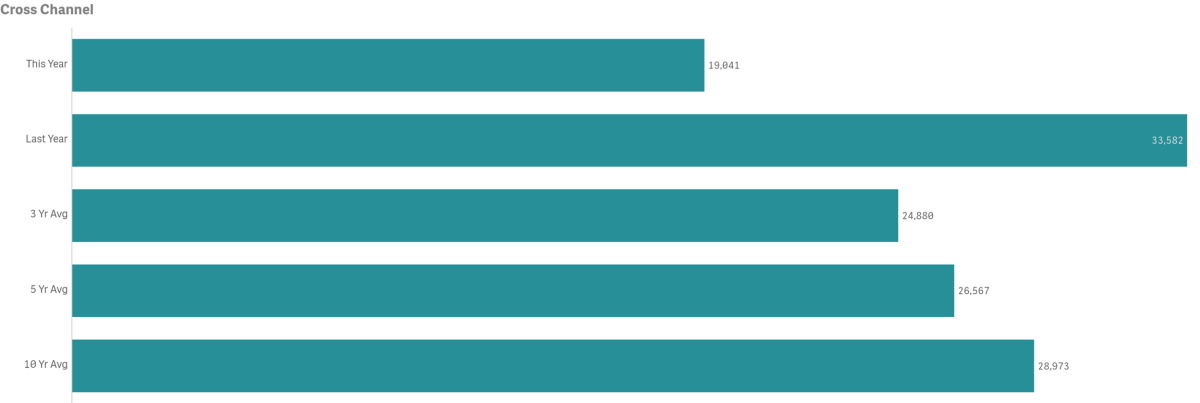
- February Cross Channel passenger counts were down 43.3% year-over-year @ 19,041 vs. 33,582 last year
- 2016 had the highest volume for the month @ 39,162 passengers
- 1998 has the lowest volume for the month @ 15,517.
- February Cross Channel passenger counts were below the three-year average of 24,889 by 23.5%
- Cross Channel Carriers made up 85.67% of total monthly arrivals
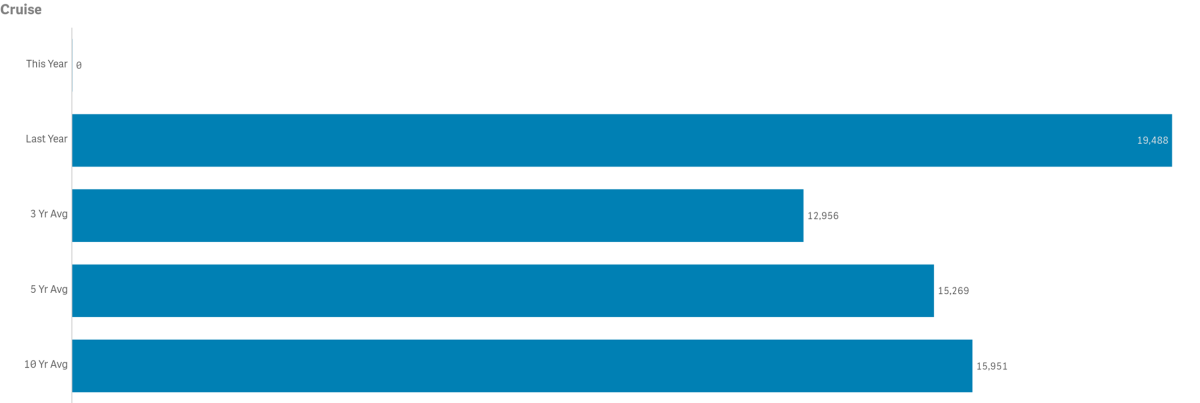
- Cruise passenger counts were down 100% year-over-year @ 0 vs. 19,488 in 2020
- 2006 had the highest cruise passenger volume for the month @ 22,927
- 2021 had the lowest cruise passenger volume for the month @ 0. Previous low was 1995 @ 4,117
- February cruise passenger counts were below the three-year average of 12,956 by 100%
- Cruise passengers made up 0% of total monthly arrivals
- The number of Cruise Ships calling on Avalon was down @ 0 vs. 8 in 2020
- 2016 and 2019 had the highest number of cruise ships in port @ 9
- 2021 had the lowest number of cruise ships in port @ 0. Previous low was 2017, 2018 and 2020 @ 8
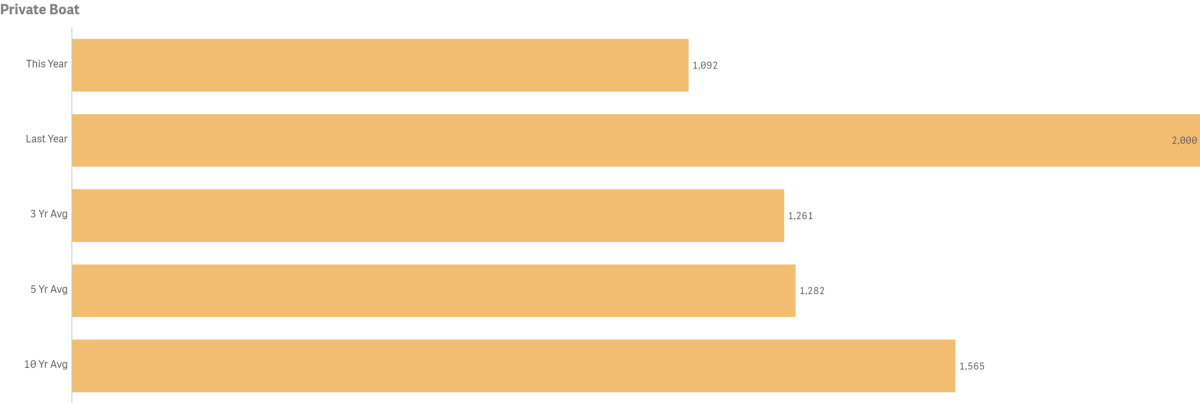
- Private Boater passenger counts were down year-over-year by 45.4% @ 1,092
- 2016 had the highest passenger volume for the month @ 2,236
- 2017 had the lowest passenger volume month @ 628
- February private boater passenger counts were below the three-year average of 1,261 by 13.4%
- February number of boats on anchor was down by 31.6% @ 39 vs. 57 last year
- 2019 had the highest number of vessels at anchor @ 104
- 2013 had the lowest number of vessels at anchor @ 2
- February number of boats on moorings was down 45.4% @ 273
- 2016 had the highest number of vessels on moorings @ 559
- 2017 had the lowest number of vessels on moorings @ 157
- Private Boaters Made up 4.91% of total monthly arrivals
 .
.
Arrivals by Air
Combined in-bound air passenger counts for February totaled 2,116, up by 61.5% from 2020.

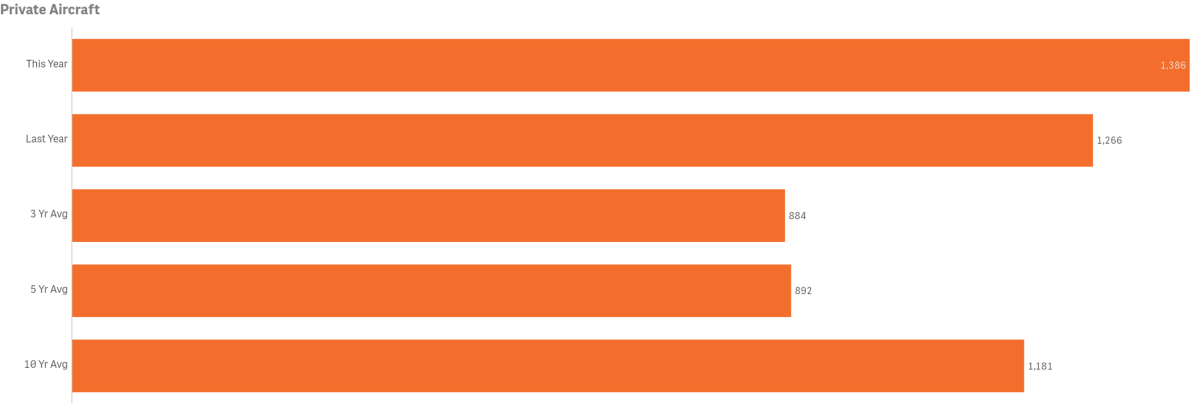
- People aboard planes (Airport in the Sky) was up 9.5% @ 1,386
- 2016 had the highest volume of private aircraft passenger counts for the month @ 2,133
- 2019 had the lowest volume of private aircraft passenger counts for the month @ 0, (construction) while 2017 had the lowest volume when open @ 606
- February counts for people aboard planes was above the three-year average of 884 by 56.8%
- February people aboard planes made up 6.24% of total monthly arrivals
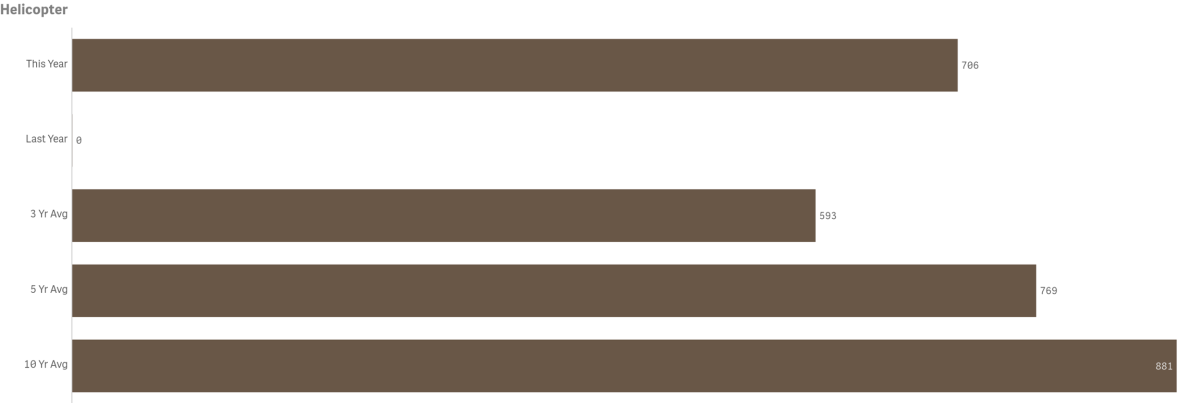
- People aboard Charter Helicopters was up year-over-year @ 706 vs. 0. Note IEX was not providing service in February 2020.
- 2018 had the highest volume for the month @ 1,399
- 2020 had the lowest volume for the month @ 0. Previous low for month was 666 in 2017
- February counts on par flat @593 by 19.4%
- February people aboard Helicopters made up 3.18% of total monthly arrivals
Year-to-Date

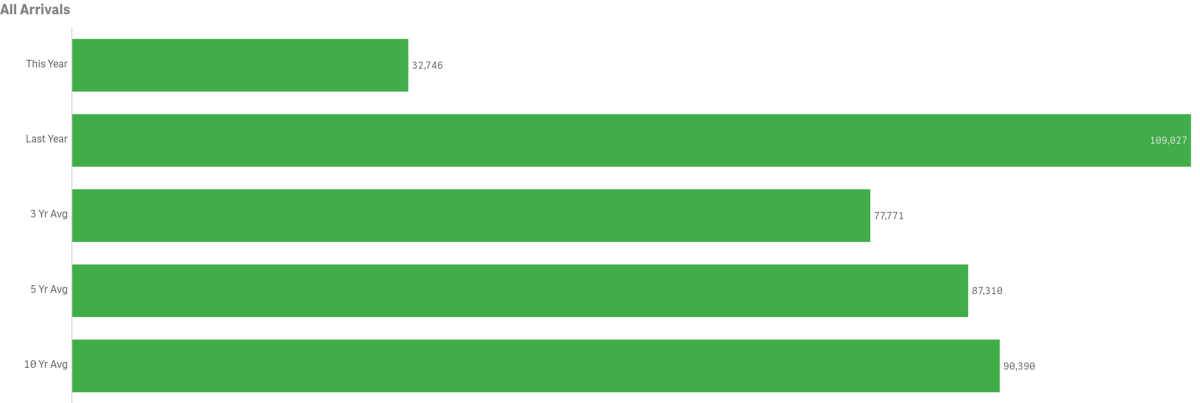
- Total arrivals year-to-date was down 70% from last year @ 32,746 or 76,281 visitors
- Total arrivals year-to-date fell below the three, five and ten year averages
To view historical data for total arrivals by sector, year and month in a spreadsheet form click here. PDF File.
Visitor Services
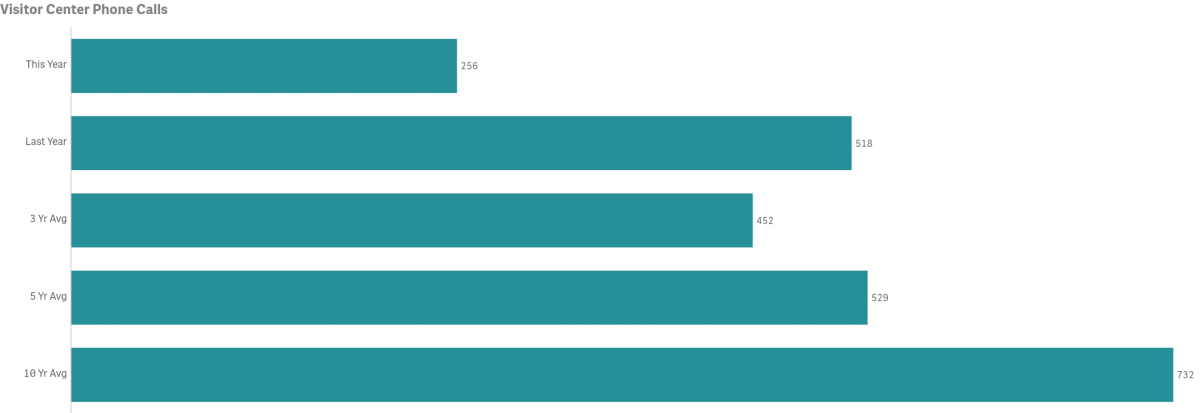
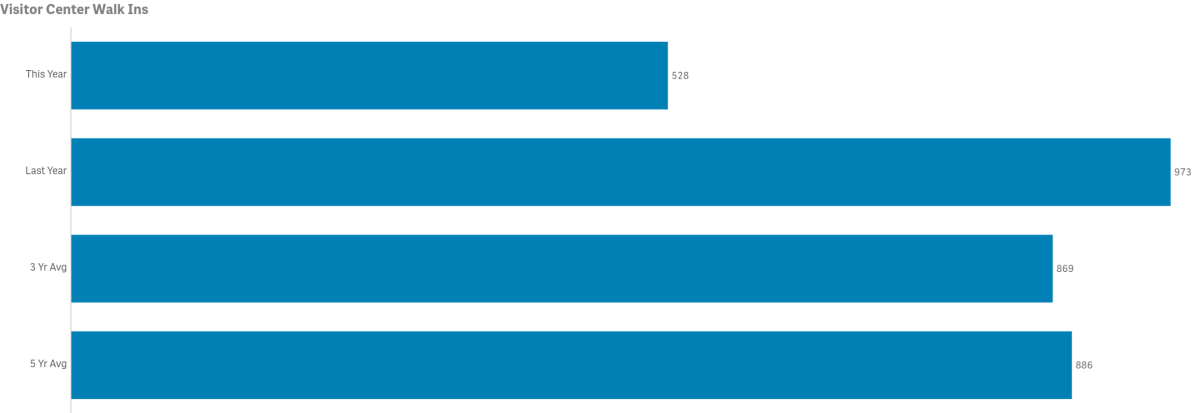
February Visitor Services decreased year-over-year in all measures.

- Number of calls for the month was down year-over-year by 50.6% @ 256 vs. 518
- 2007 had the highest volume for the month @ 1,265 calls
- 2021 had the lowest volume for the month @ 256 calls. Previous low for month was 518 in 2020
- February counts were below the three-year average of 452 by 43.4%
- Number of Walk Ins for the month was down year-over-year by 45.7% @ 528 vs. 973. The Visitor Center was closed two days a week due to limited visitor volume.
- 2019 had the highest volume for the month @ 1,105 guests
- 2021 had the lowest volume for the month @ 528 guests. Previous low for month was 875 in 2017
- February counts were below the three-year average of 869 by 39.2%
LoveCatalina.com
February LoveCatalina.com Website users were 73,604 vs. 86,734 in 2020
February Printed Visitor Guide orders @ LoveCatalina.com @ 734
February Online Guide downloads @ 124
Monthly E-blast consumer sign-ups @ 125
Monthly Book Direct lodging searches 19,172
Monthly Book Direct referrals 10,579
Monthly Book Direct Package referrals are currently unavailable
Weather
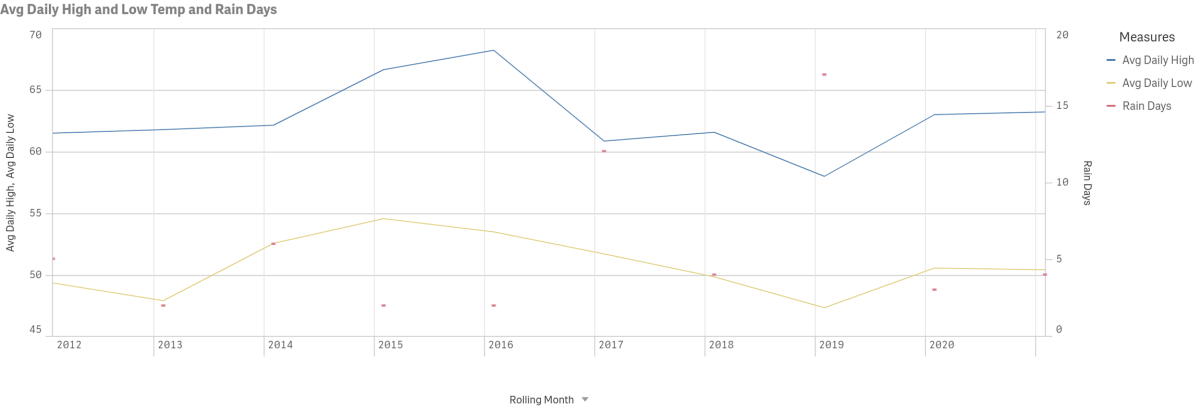
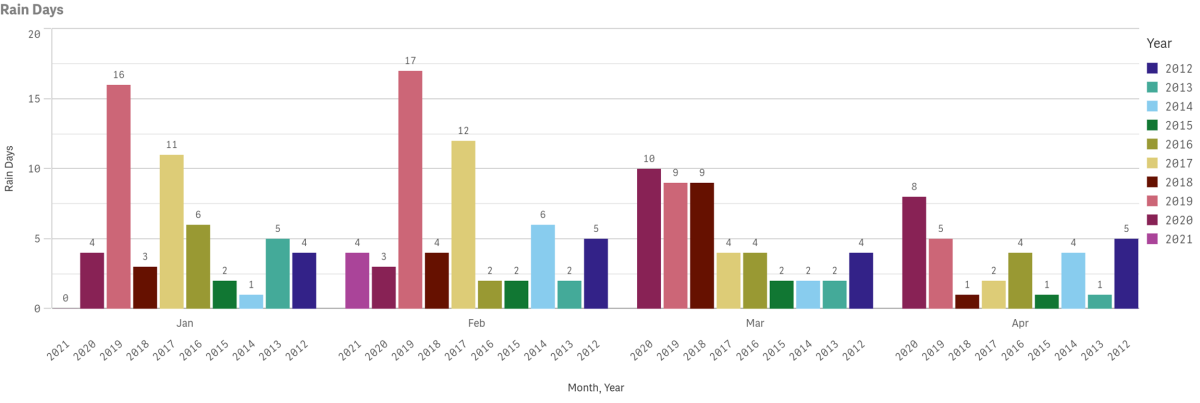
Data for February highs, lows and precipitation going back to 2012 is displayed below. Multi-year rain days data is also displayed by year and month. Measures are taken at Avalon Harbor.
Explore the Island
51st Annual New Year’s Eve Gala Celebration
Reservations are On Sale!
A sparkling night of evening gowns, tuxedos, champagne, dining and dancing on Tuesday, December 31 in the world-famous Casino Ballroom.
