December 2021 Visitor Stats
All Arrivals
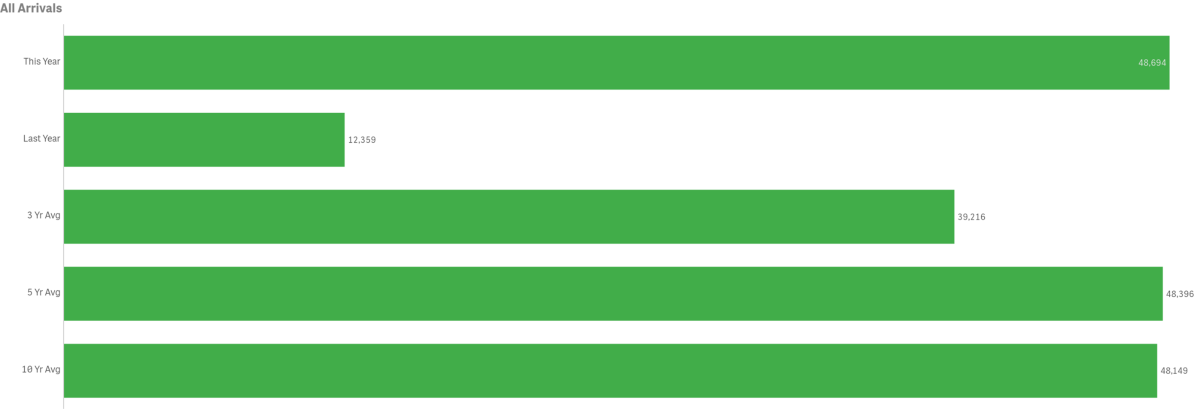
Despite ongoing impacts from COVID-19 on travel, December visitation increased significantly year-over-year, resulting in an overall increase by 294% or 36,335 visitors over the same month last year.
Previous December tracking (below) offers a comparison without COVID-19 impacts. December 2021’s total of 48,694 fell short of December 2019’s pre COVID-19 total arrivals of 56,595.


December’s total in-bound passenger count was above the three-year average of 39,216 and was on par with the five and ten-year averages of 48,396 and 48,140 respectively.
Arrivals by Sea
Passengers arriving by sea, including private boaters, totaled 47,018 for the month of December, up by 321.6% from last year.


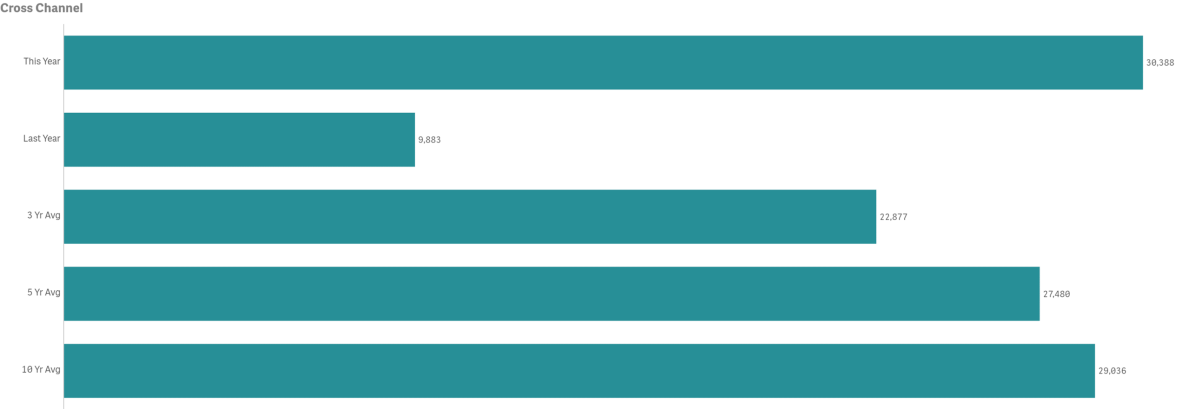
- December Cross Channel Passenger counts were up year-over-year by 207.5% or an increase of 20,505 people
- 2014 had the highest volume for the month @ 39,960 passengers
- 2020 had the lowest volume for the month @ 9,883
- 2009 had the lowest volume for the month, pre-COVID-19 @ 17,593
- December Cross Channel Passenger counts were above the three, five and ten-year averages by 32.8%, 10.6% and 4.7% respectively
- Cross Channel Passengers made up 62.4% of total monthly arrivals
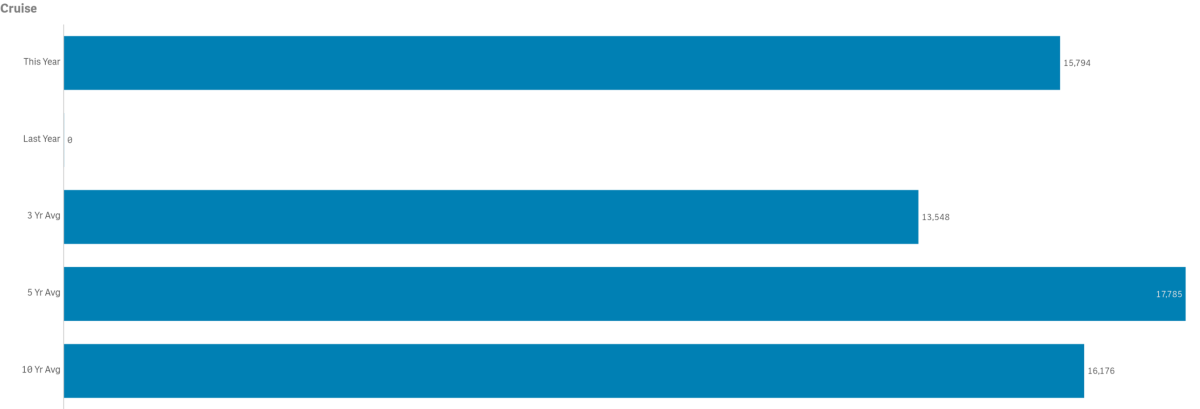
- Cruise passenger counts totaled 15,794
- 2005 had the highest Cruise Passenger volume for the month @ 25,612
- 2020 had the lowest Cruise Passenger volume for the month @ 0. Pre-COVID-19 low was 2008 @ 4,662
- December Cruise Passenger counts were above the three-year average by 16.6% but below the five and ten-year averages by 11.2% and 2.4% respectively
- Cruise Passengers made up 32.4% of total monthly arrivals
- The number of Cruise Ships calling on Avalon was 9
- 2016 had the greatest number of ships @ 11
- 2020 had the lowest number of ships @ 0, pre-COVID-19 2018 had the lowest number @ 10
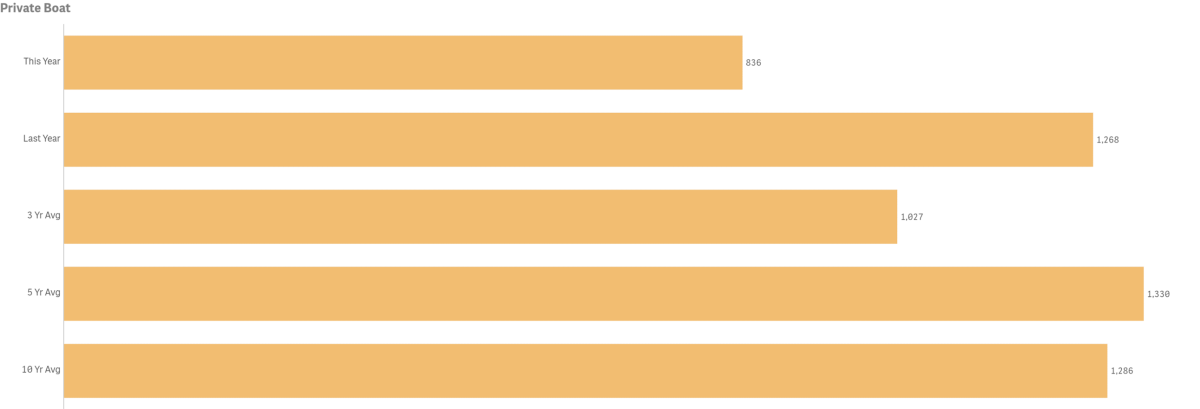
- Private Boater Passenger counts were down year-over-year @ 836 vs. 1,268 in 2020
- 2017 had the highest passenger volume for the month @ 2,216
- 2015 had the lowest passenger volume month @ 864
- December Private Boater Passenger counts were below the three, five and ten-year averages by 18.6%, 37.2% and 35.0% respectively
- December’s number of Vessels Anchored was up @ 80 vs. 66 last year
- 2018 had the highest number of Vessels Anchored @ 107
- 2016 had the lowest number of Vessels Anchored @ 5
- December 2021 was below the average number of Vessels Anchored for three, five and ten-year averages by 15.4%, 2.6% and 34.9% respectively
- December’s number of Vessels on Moorings was down @ 209 vs. 317 last year
- 2011 had the highest number of Vessels on Moorings @ 522
- 2013 had the lowest number of Vessels on Moorings @ 11
- December 2021 was below the three, five and ten-year averages for Vessels on Moorings by 18.6%, 37.2% and 23.0% respectively
- Private Boaters Made up 1.7% of total monthly arrivals
Arrivals by Air
Combined in-bound air passenger counts for December totaled 1,693, up from 1,219 in 2020.
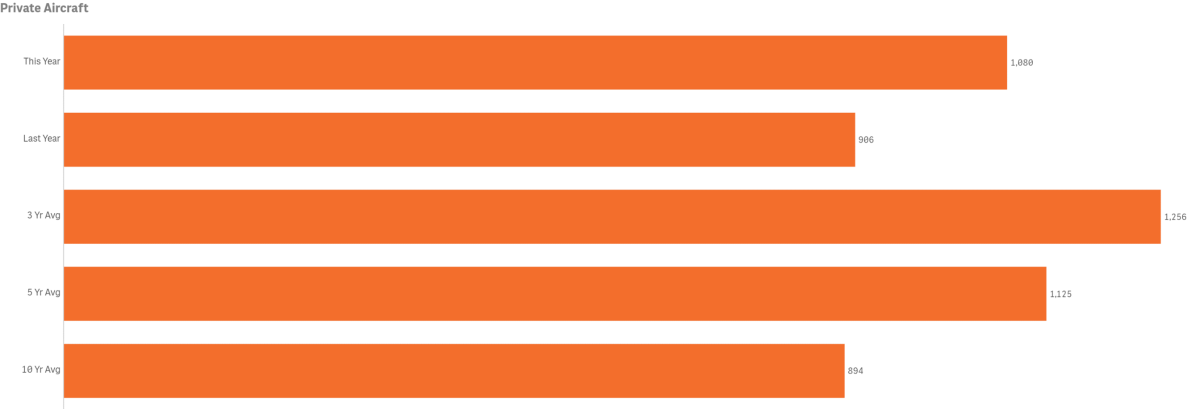
- Private Aircraft Passengers (Airport in the Sky) was up @ 1,080 from 906 last year
- 2019 had the highest volume of Private Aircraft Passengers for the month @ 1,782
- 20018 had the lowest volume of Private Aircraft Passengers for the month @ 447
- December counts for Private Aircraft Passengers was below the three and five-year averages by 14.0%, 4.0% respectively, but above the 10-year average by 20.8%
- December Private Aircraft Passengers made up 2.2% of total monthly arrivals
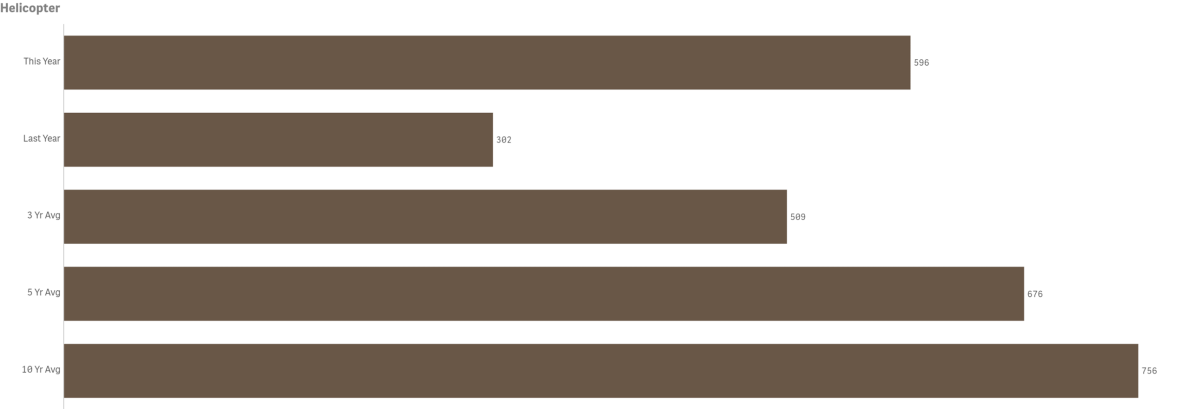
- Helicopter Passenger counts were up 97.4% year-over-year @ 596 vs. 302
- 2016 had the highest volume for the month @ 998
- 2011 had the lowest volume for the month @ 459
- December counts for Helicopter Passengers was above the three-year average by 17.1% but below the five and ten-year averages of by 11.8% and 21.2% respectively
- December counts for Helicopter Passengers made up 1.2% of total monthly arrivals
Lodging
Hotel and Short-Term Rental Occupancy from Smith Travel and AIRDNA
- Hotel Occupancy for December 2021 was 57.5%, up from 31.4% in 2020
- December 2021 Hotel Occupancy exceeded Monterey, but was below Palm Springs, San Diego, Huntington Beach, Anaheim, San Francisco and Santa Barbra in our competitive set
- Hotel Average Daily Rate was $173.38, up from $117.14 in 2020
- Hotel Revenue Per Available Room was $99.74, up from $36.74 in 2020
- Short-Term Rental Occupancy for December was 41%, up from 28% in 2020
- December 2021 Short-Term Rental Occupancy exceeded no destinations in our competitive set being below Palm Springs, Santa Barbara, San Diego, Newport Beach, Huntington Beach, Monterey, Anaheim, San Francisco and Santa Monica
- Short-Term Rental Average Daily Rate was $452.00, up from $395 in 2020
- Short-Term Rental Revenue Per Available Room was $156.00, up from $112.00 in 2020
Visitor Services
December Visitor Services were up year-over-year.
Catalina Island Visitor Center

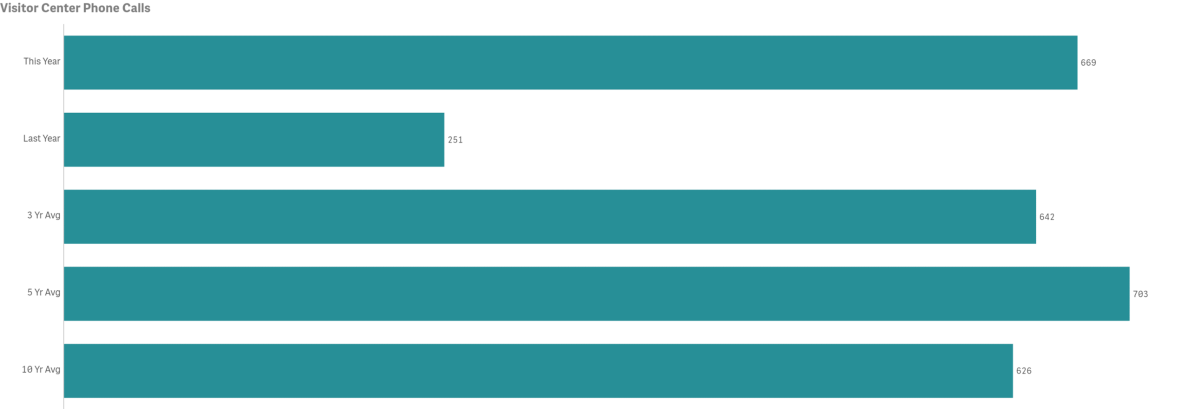
- Number of Phone Calls for the month was up year-over-year by 166.5% @ 669 vs. 251
- 2007 had the highest volume for the month @ 1,044 calls
- 2020 had the lowest volume for the month @ 251 calls. Pre-COVID-19 lowest call volume was 2015 @ 406
- December call counts were above the three-year average of 642 and the ten-year average of 626, but below the five-year average of 703
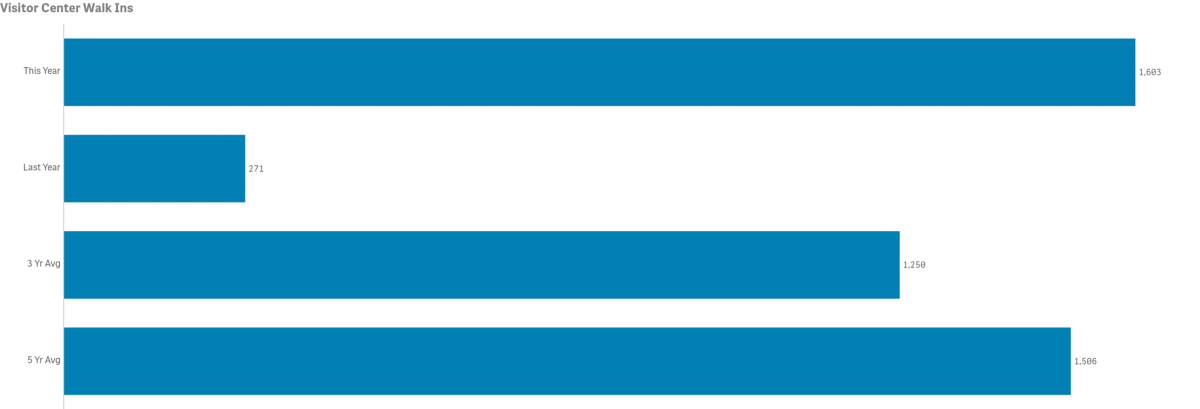
- Number of Walk-Ins for the month was up year-over-year @ 1,603 vs. 271
- 2016 had the highest volume of Walk-ins for the month @ 2,366 guests
- 2020 had the lowest volume of Walk-ins for the month @ 271 guests. Pre COVID-19 lowest volume of guests was 2018 @ 1,846
- December Walk-In counts were above the three, five and ten-year average of 1,250, 1,506 and 990 respectively
LoveCatalina.com

- December LoveCatalina.com website users were up year-over-year by 71.6% @ 56,333 vs. 32,820 in 2020
- Website users were down 1.9% from the three-year average
- Website users are down in-part due to suspension of a pay-per click campaign that is now reallocated to a co-op website instead
- Book Direct lodging searches were up year-over-year by 59.1% @, 6,320 vs. 3,972 in 2020
- Lodging searches were down 26.8% from three-year average
- Note changes to Book Direct on member links has resulted in shifting more traffic to referrals vs. searches
- Book Direct referrals were up by 83.9% @ 5,004 vs.2,721 in 2020
- Referrals were down 17.9% from the three-year average
Visitor Guides & Newsletters

- Note above numbers do not include racks and California Welcome Center/local Visitor Center distributions
- Printed Visitor Guide orders @ LoveCatalina.com @ 21, down from 217 or 90.3% from last year
- No 2021 Guide was printed
- Online Guide downloads were up by 400% @ 230 vs.46 in 2020
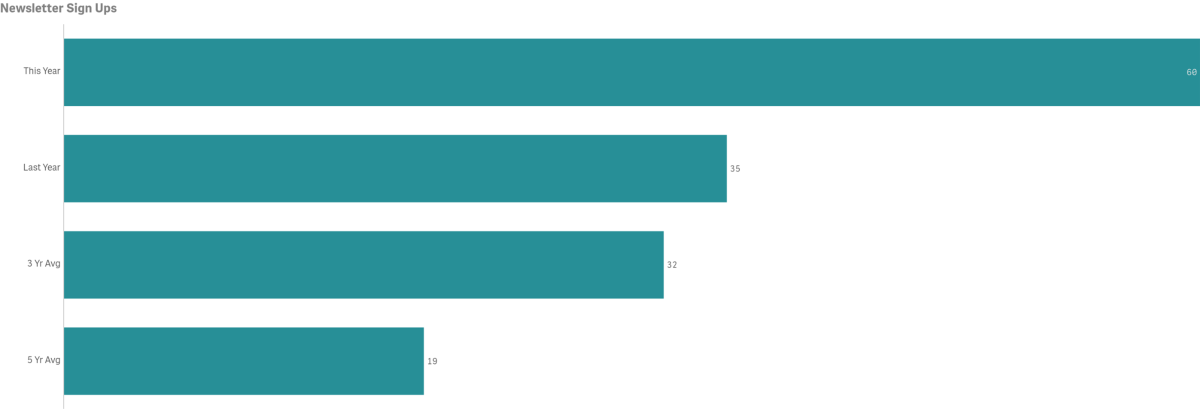
- New E-blast subscribers in December were up year-over-year @ 60 vs. 35 in 2020
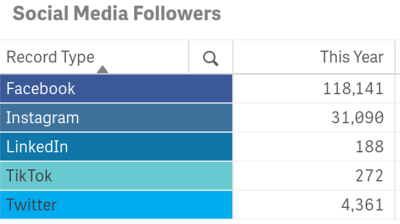
Social Media cumulative totals by platform as of December below.
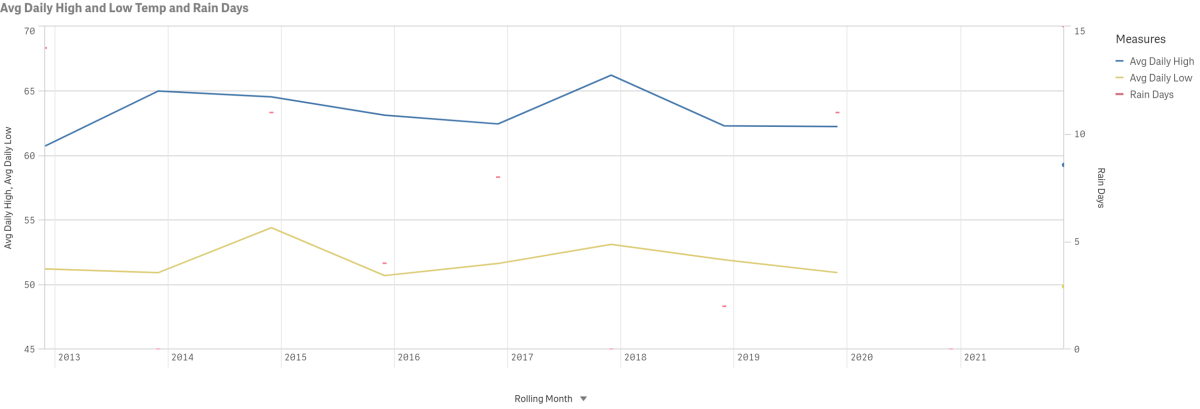
Weather
Data for December highs, lows and precipitation going back to 2012 is displayed below. Multi-year rain days data is also displayed by year and month. Measures are taken at Avalon Harbor.
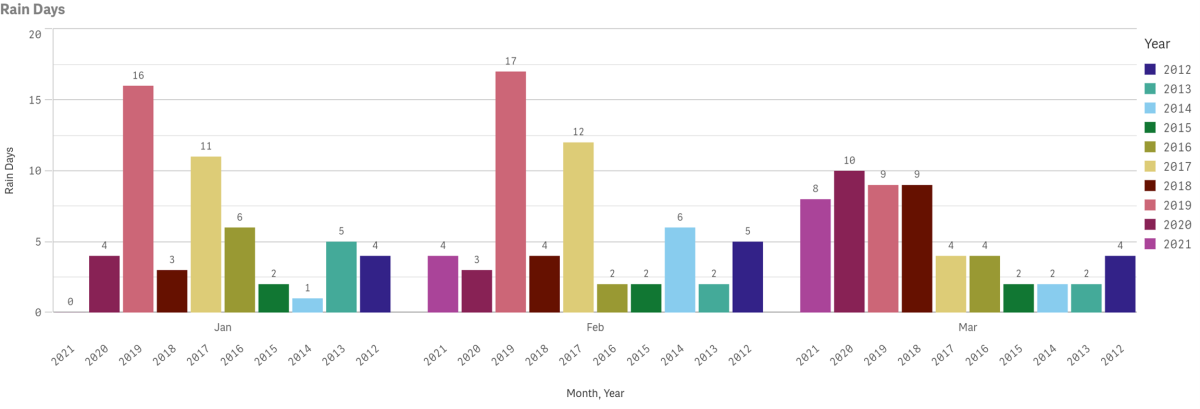
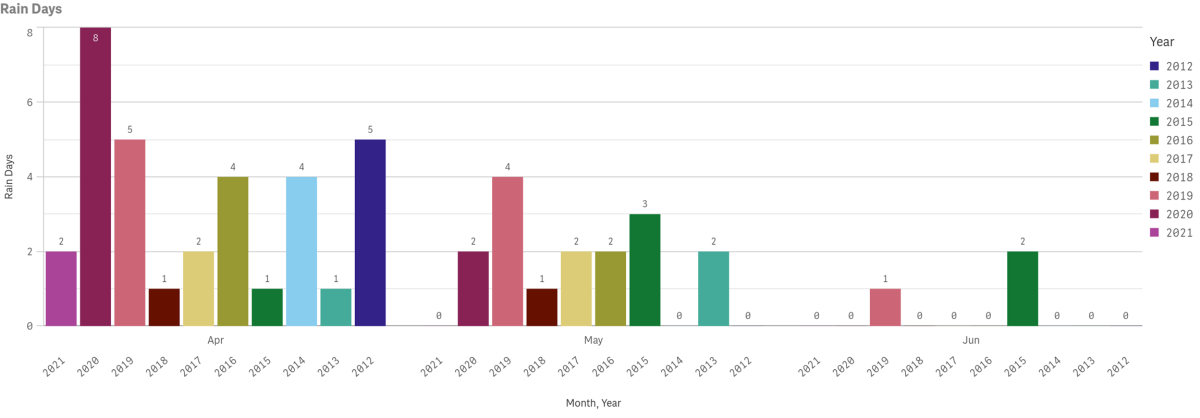
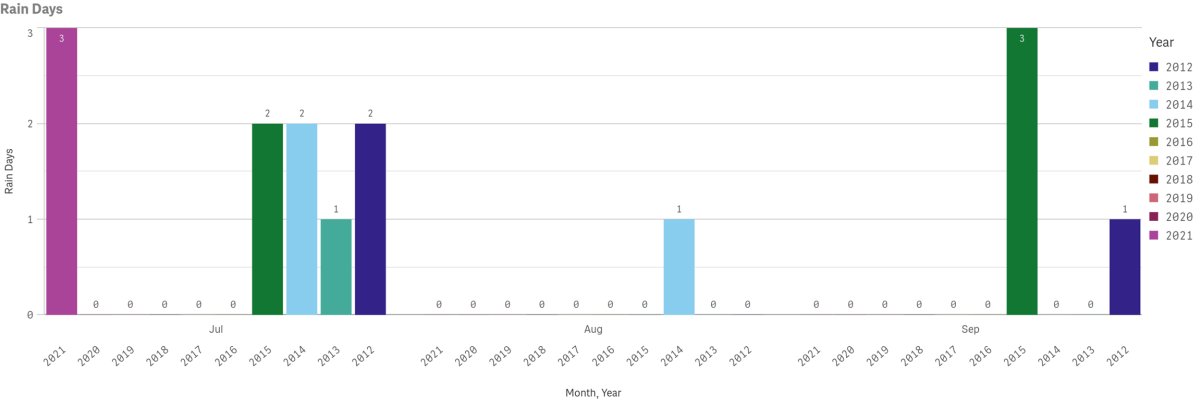
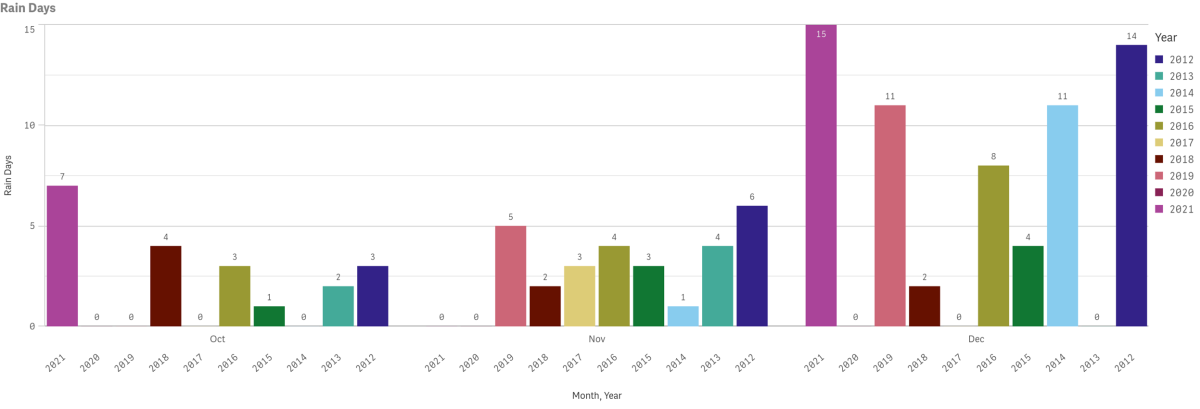
January-December 2021 Year-End Reporting
2021 Total Arrivals
Total year-end arrivals are up from last year by 55%. Keep in mind that current and multi-year figures include impacts of COVID-19 from present back to March 2020.

- Total Arrivals year-to-date was up @ 813,051 vs. 503,210 last year or a difference of 309,841 visitors
- Total Arrivals year-to-date exceeded the three-year average of 779,146 by 4.4%
- Total Arrivals year-to-date were below the five and ten-year averages of 898,323 and 931,152 respectively
- All arrival sectors are up year-to-date with the exception of Cruise
Historical
COVID-19 and pre-Covid-19 comparison data is illustrated below

- 2017 had the highest total visitation @ 1,097,500
- 2020 had the lowest total visitation @ 503,210
- 2012 had the lowest pre COVID-19 visitation @ 818,133
- All arrival sectors are up 2021 year-end compared to 2019 with the exception of Cruise
To view historical data for total arrivals by sector, year and month in a spreadsheet form click here. PDF File.
2021 Lodging
Hotel and Short-Term Rental Occupancy from Smith Travel and AIRDNA
- Hotel Occupancy for 2021 averaged 65.1%, up from 52.1% in 2020
- 2021 Hotel Occupancy exceeded Santa Barbara, but was below Palm Springs, Newport Beach, San Diego, Huntington Beach, Anaheim, San Francisco, Monterey and Santa Monica in our competitive set
- 2121 Hotel Average Daily Rate was $212.43, up from $166.10 in 2020
- Hotel Revenue Per Available Room in 2021 was $138.38 up from $86.59 in 2020
- 2021 Short-Term Rental Occupancy averaged 59%, up from 41% in 2020
- 2021 Short-Term Rental Occupancy exceeded no destinations in our competitive set, but tied with Palm Springs
- Short-Term Rental Average Daily Rate for 2021 was $543.00, up from $506.00 in 2020
- Short-Term Rental Revenue Per Available Room in 2021 was $320.00, up from $206.00 in 2020
2021 Catalina Island Visitor Center

- Number of Phone Calls for the Year was up by 23.8% @ 8,064 vs. 6,514
- 2008 had the highest volume @ 20,077 calls
- 2013 had the lowest volume @ 3,426 calls.
- 2021 call counts were below the three-year average of 8,659
- Number of Walk-Ins for the year was up by 282.3% @ 24,642 vs. 6,445. In 2020 the center was closed many days due to COVID-19 restrictions and was further impacted by the lack of Cruise visitors
- 2018 had the highest volume of Walk-ins @ 49,741 guests
- 2020 had the lowest volume of Walk-ins @ 6,445 guests.
- 2021 Walk-In counts were above the three-year average of 20,455
2021 LoveCatalina.com

- 2021 LoveCatalina.com website users were up year-over-year by 24.2% @ 1,046,220 vs. 842,140 in 2020
- Through year-end Book Direct lodging searches were up by 39.0% @, 197,184 vs. 141,909 in 2020
- 2021 Book Direct referrals were up by 66.1% @ 186,661 vs. 112,382 in 2020
2021 Visitor Guides & Newsletters
- Printed Visitor Guide orders @ LoveCatalina.com @ 1,790 was down from 7,503 from last year. This does not include rack or trade show distributions
- No 2021 Guide was printed
- Digital Guide downloads were up @ 5,140 vs.1,848 in 2020
- New E-blast subscribers January-December was up @ 1,555 vs. 622 in 2020
Explore the Island
51st Annual New Year’s Eve Gala Celebration
Reservations are On Sale!
A sparkling night of evening gowns, tuxedos, champagne, dining and dancing on Tuesday, December 31 in the world-famous Casino Ballroom.
