
August 2021 Visitor Stats
August continued to show significant signs of recovery from COVID-19 related impacts, though at a slower pace than June or July.
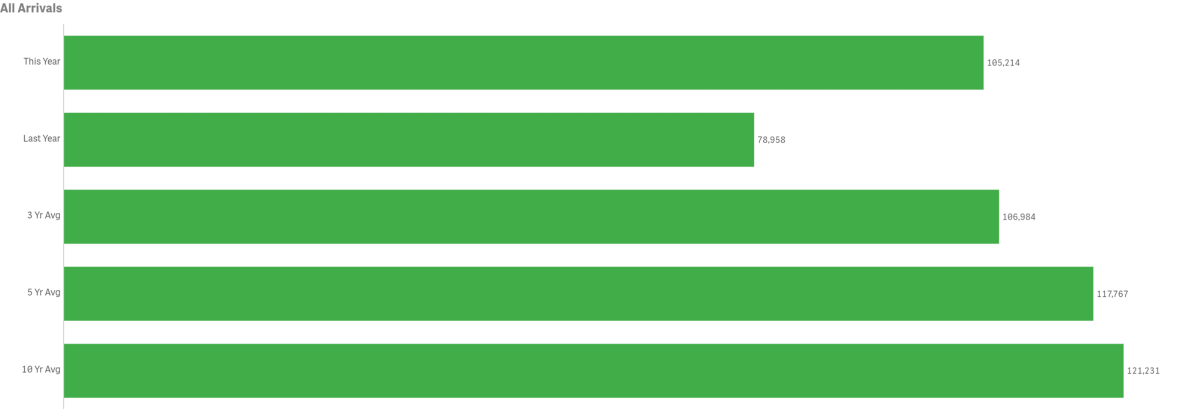
All Arrivals
August visitation increased year-over-year, resulting in an overall increase by 33.3% or 26,256 visitors over the same month last year.
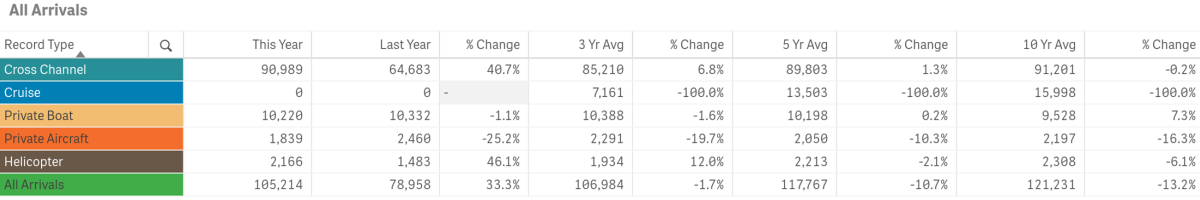
Previous August tracking (below) offers a comparison without COVID-19 impacts. August 2021’s total of 105,214 fell short of August 2019’s total arrivals of 136,781.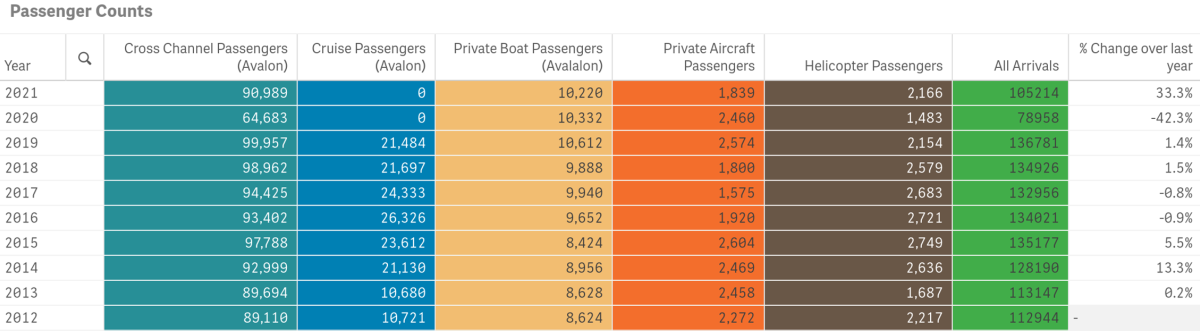
August’s total in-bound passenger count was above the three and five-year averages but below the ten-year average. August 2021 trailed the same month in 2019 by 31,567 visitors.
Arrivals by Sea
Passengers arriving by sea, including private boaters, totaled 101,209 for the month of August, up by 26,194 from last year.
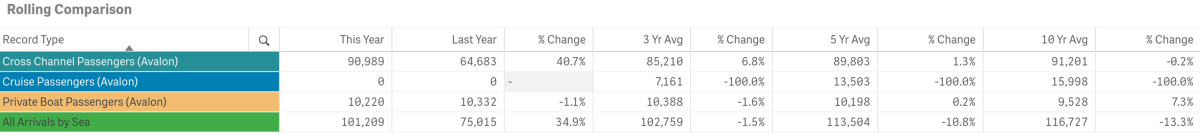
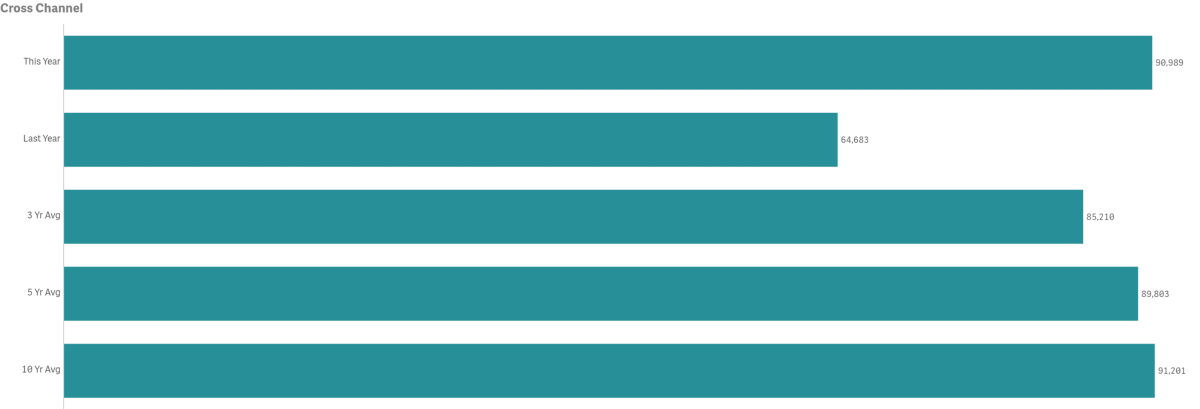
- August Cross Channel passenger counts were up year-over-year @ 90,989 vs. 64,683 last year
- 1990 had the highest volume for the month @ 121,064 passengers
- 2020 had the lowest volume for the month @ 64,083. Pre-COVID-19 the lowest count for the month was in 2009 @ 75,672
- 2019 had 99,957 Cross Channel passengers or 8,968 more passengers than 2021
- August Cross Channel passenger counts were above the three-year average of 85,219 by 6.8%
- August Cross Channel passenger counts were above the five-year average of 89,803 by 1.3%
- August Cross Channel passenger counts were below the ten-year average of 91,201 by 0.2%
- Cross Channel Carriers made up 86.48% of total monthly arrivals
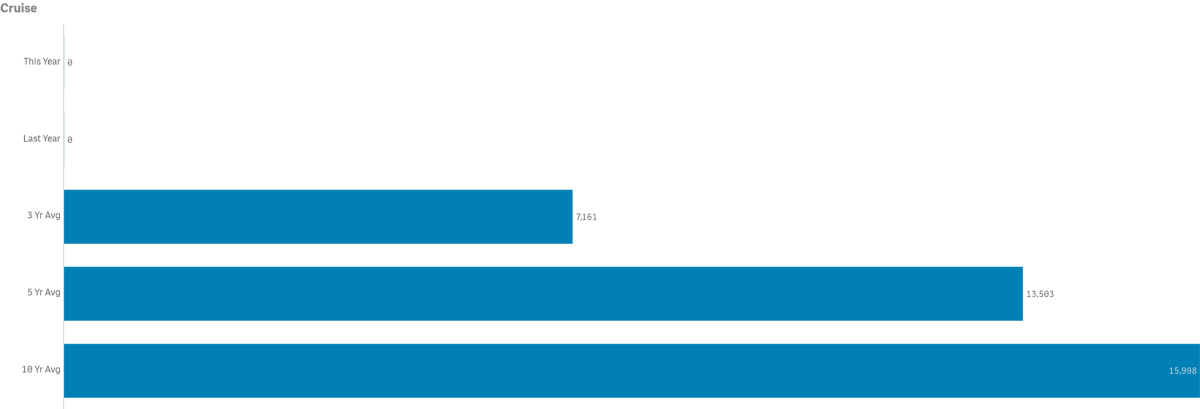
- Cruise passenger counts were 0 for the second year
- 2016 had the highest Cruise passenger volume for the month @ 26,326
- 2021 tied with 2020 as the lowest Cruise passenger volume for the month @ 0. Previous low was 1990 @ 13,690
- August Cruise passenger counts were below the three-year average of 7,161 (includes two years of 0 passengers)
- August Cruise passenger counts were below the five-year and ten-year averages of 13,503 and 15,958 respectively (includes two years of 0 passengers)
- Cruise passengers made up 0% of total monthly arrivals
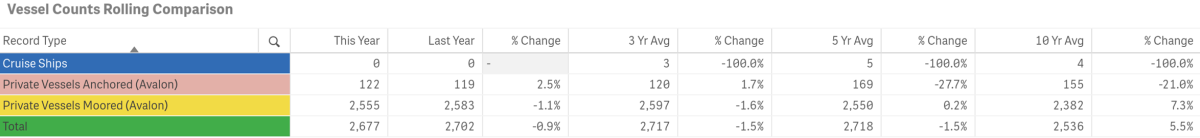
- The number of Cruise Ships calling on Avalon was 0
- 2016 and 2018 had 10 ships in August, with prior years typically having 9
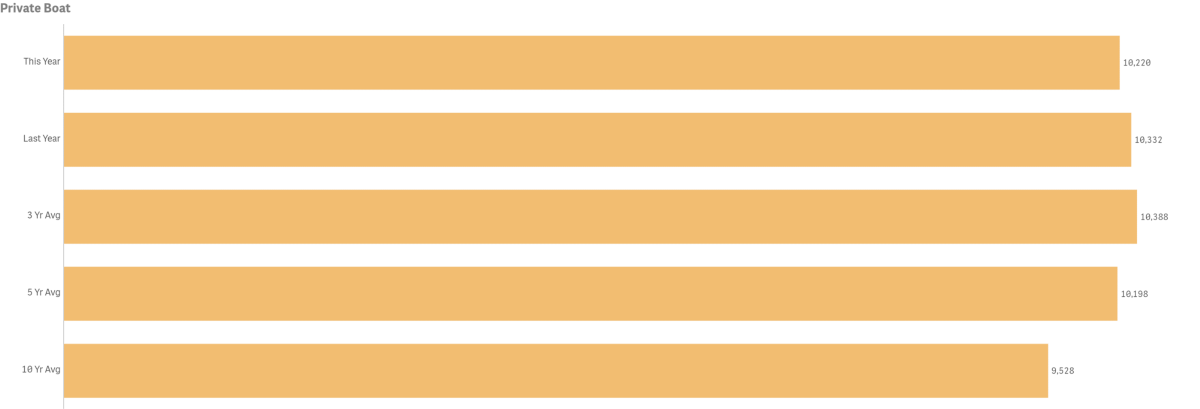
- Private Boater passenger counts were down slightly year-over-year @ 10,220
- 2019 had the highest passenger volume for the month @ 10,612
- 2015 had the lowest passenger volume month @ 8,424
- August private boater passenger counts were below the three-year average of 10,388 by 1.6%
- August private boater passenger counts were above the five-year and ten-year average of 10,958 and 9,528 respectively
- August’s number of boats on anchor was up slightly @ 122 vs.119 last year
- 2017 had the highest number of vessels anchored @ 259
- 2012 had the lowest number of vessels anchored @ 110
- August’s number of boats on moorings was down 1.1% @ 2,555 vs. 2,583 last year
- 2019 had the highest number of vessels on moorings @ 2,653
- 2012 had the lowest number of vessels on moorings @ 2,156
- Private Boaters Made up 9.7% of total monthly arrivals
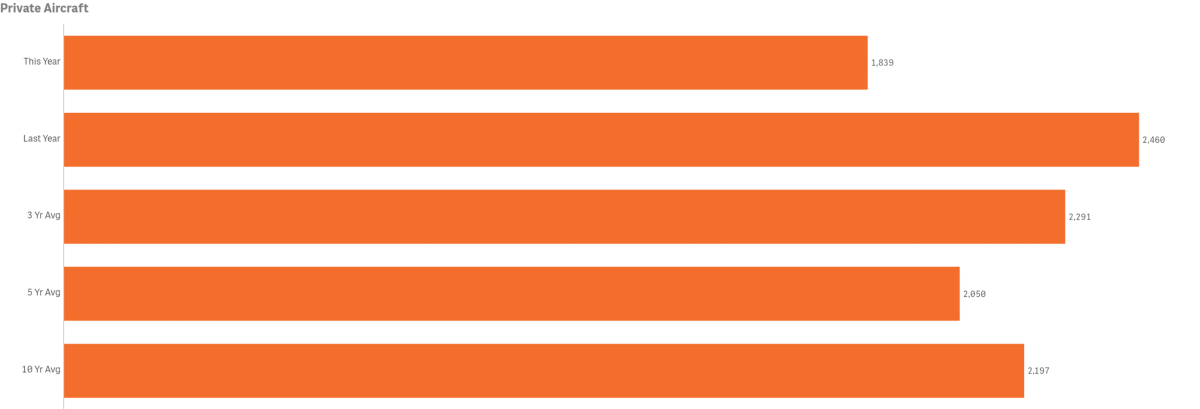
Arrivals by Air
Combined in-bound air passenger counts for August totaled 4,069, up from 4,035 in 2020.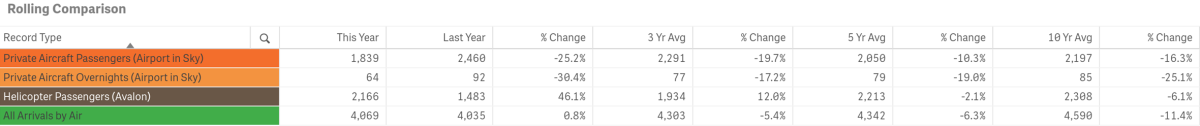
- People aboard planes (Airport in the Sky) was down @ 1,839 from 2,460 last year
- 2008 had the highest volume of private aircraft passengers for the month @ 2,644
- 2017 had the lowest volume of private aircraft passengers for the month @1,575
- August counts people aboard planes was below the three-year average of 2,291 by 19.7%
- August counts for people aboard planes was below the five-year and ten-year averages of 2,050 and 2,197 respectively
- August people aboard planes made up 1.75% of total monthly arrivals
- People aboard Charter Helicopters was up year-over-year @ 2,166 vs. 1,483
- 2015 had the highest volume for the month @2,749
- 2020 had the lowest volume for the month @ 1,483. Previous low for month was 1,687 in 2013
- August counts for people aboard Helicopters was above the three-year average of 1,934 by 12%
- August counts for people aboard Helicopters was below the five-year and ten-year averages of 2,213 and 2,308 respectively
- August people aboard Helicopters made up 2.06% of total monthly arrivals

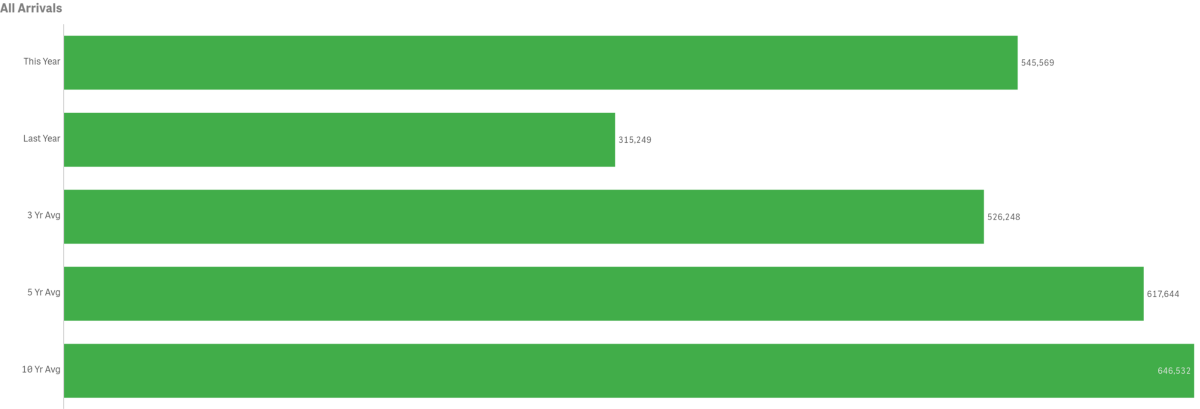
Year-to-Date
Total year-to-date arrivals are up from last year by 73.1%
- Total Arrivals year-to-date was up from last year @ 545,569 vs. 315,249 or a difference of 230,320 visitors
- Total Arrivals year-to-date exceeded the three-year average of 526,248
- Total Arrivals year-to-date were below the five and ten-year averages of 617,644 and 646,532 respectively
- All arrival sectors are up year-to-date with the exception of Cruise

Year-to-Date--Historical
Pre-Covid-19 comparison data is illustrated below.
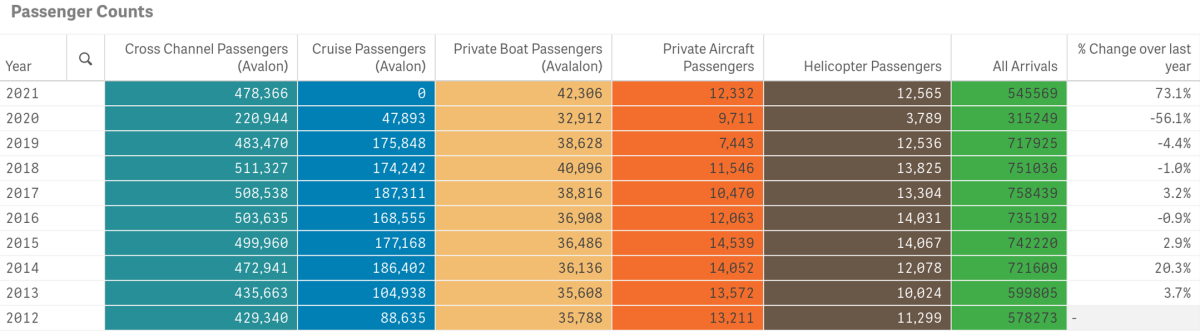
- 2017 had the highest total visitation year-to-date @ 758,439
- Compared to 2017, year-to-date total arrivals are down by 212,870
- 2019 had 717,925 visitors year-to-date
- Compared to 2019, year-to-date total arrivals are down by 172,356 people
- Cross Channel and Cruise arrivals are down year-to-date compared to 2019 while Private Boat, Private Aircraft and Helicopter arrivals are up.
To view historical data for total arrivals by sector, year and month in a spreadsheet form click here. PDF File.
Visitor Services
August Visitor Services varied up and down by measure year-over-year.
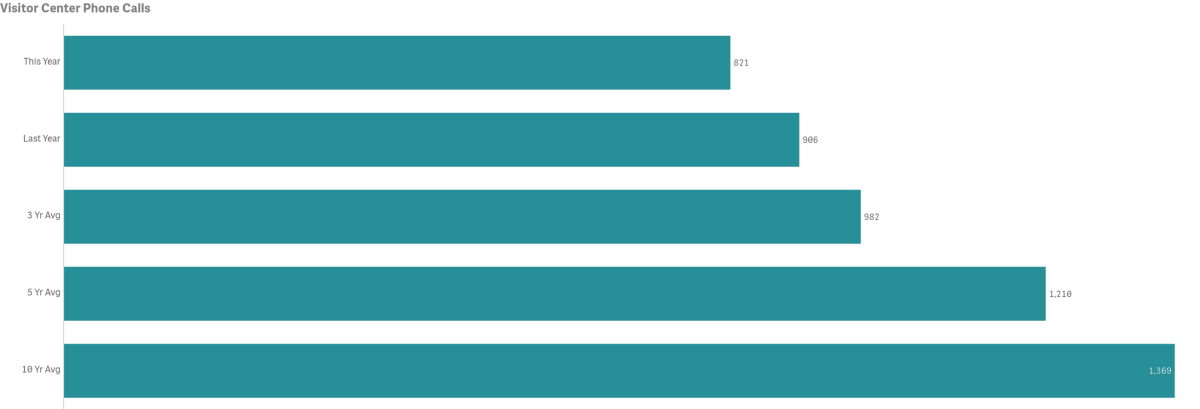
Catalina Island Visitor Center

- Number of calls for the month was down year-over-year by 9.4% @ 821 vs. 906
- 2011 had the highest volume for the month @ 2,813 calls
- 2021 had the lowest volume for the month @ 821 calls
- August call counts were below the three-year average of 982 by 16.4%
- Note that a change in New Year’s Eve reservations (launched each year in August) from phone to online has resulted in significant reduction in phone calls
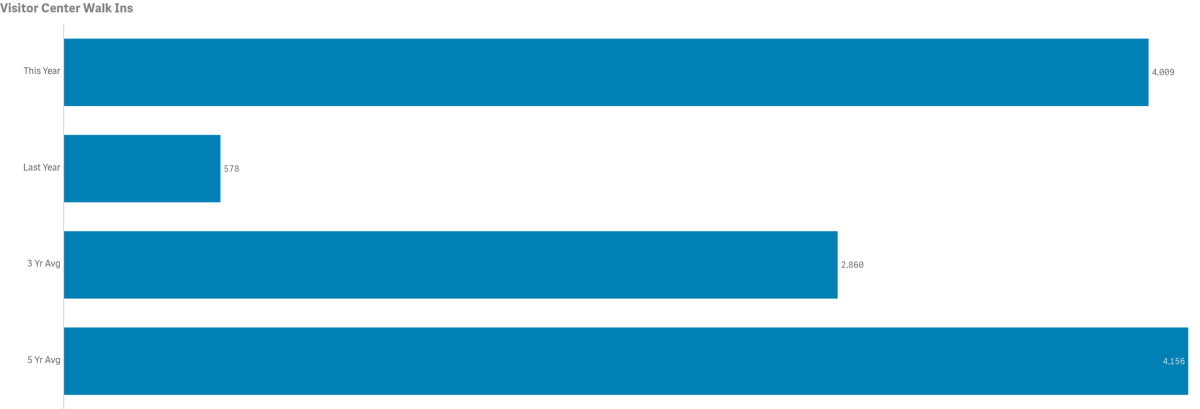
- Number of Walk-Ins for the month was up year-over-year @ 4,009 vs. 578
- 2016 had the highest volume of walk-ins for the month @ 6,431 guests
- 2020 had the lowest volume of walk-ins for the month @ 578 guests, previous low was 2019 @ 3,992
- August Walk-In counts were above the three-year average of 2,860 by 40.2%
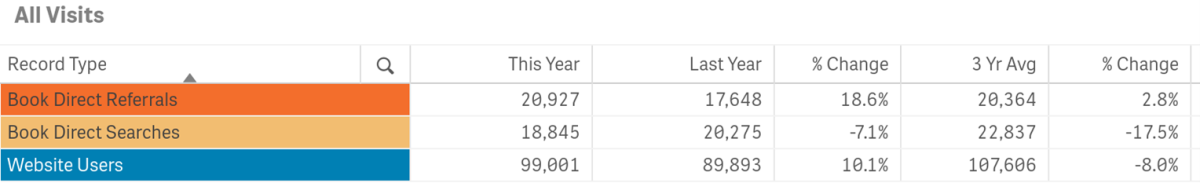
LoveCatalina.com
All figures below are for the month of August 2021
LoveCatalina.com website users totaled 99,001 vs. 89,893 in 2020
Book Direct lodging searches 18,845 vs. 20,275 in 2020
Book Direct referrals 20,927 vs. 17,624 in 2020
Note changes to Book Direct on member links has resulted in shifting more traffic to referrals vs. searches
Printed Visitor Guide orders @ LoveCatalina.com @ 37
Online Guide downloads @ 477
E-blast consumer new subscribers @ 124
Note above numbers do not include rack and visitor center distributions
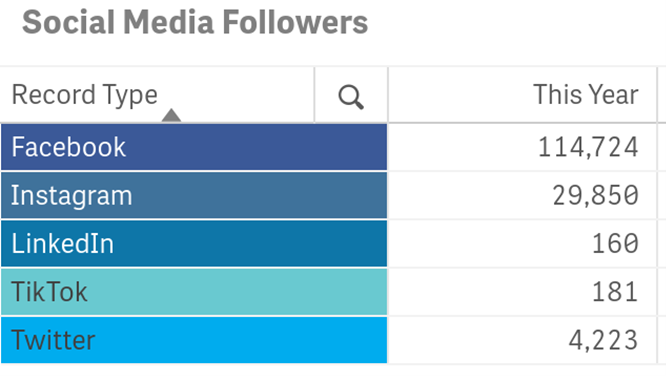
Social Media cumulative totals by platform as of August below
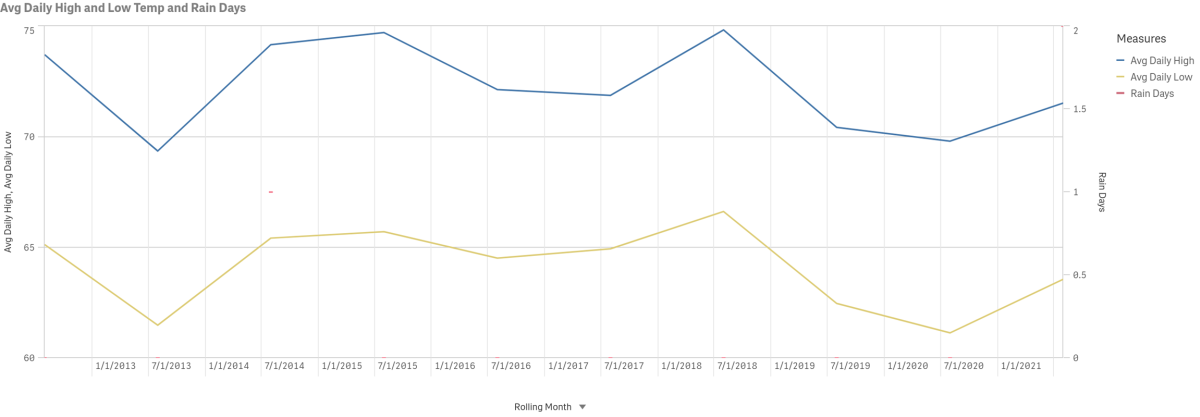
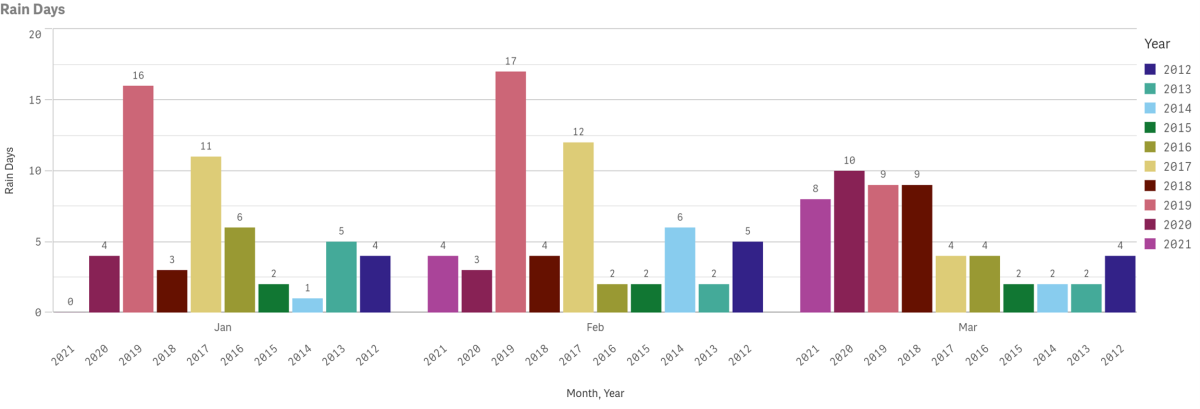
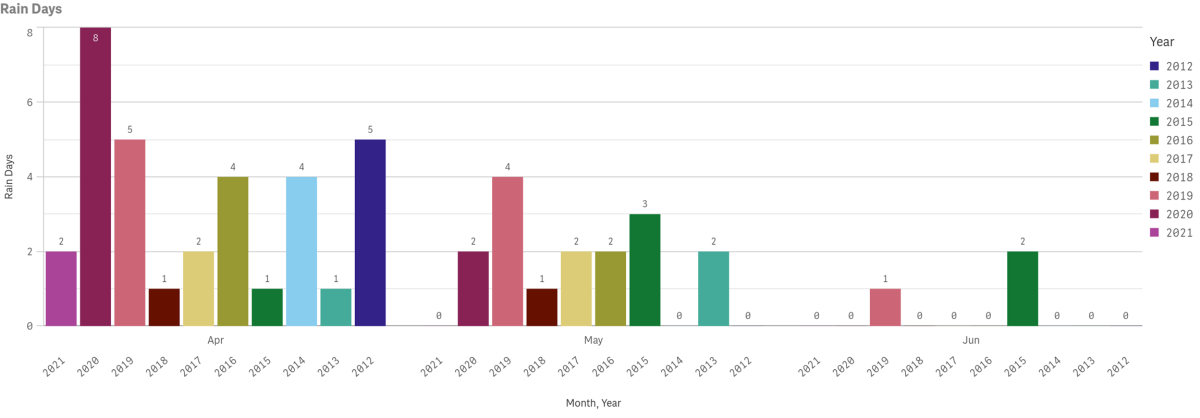
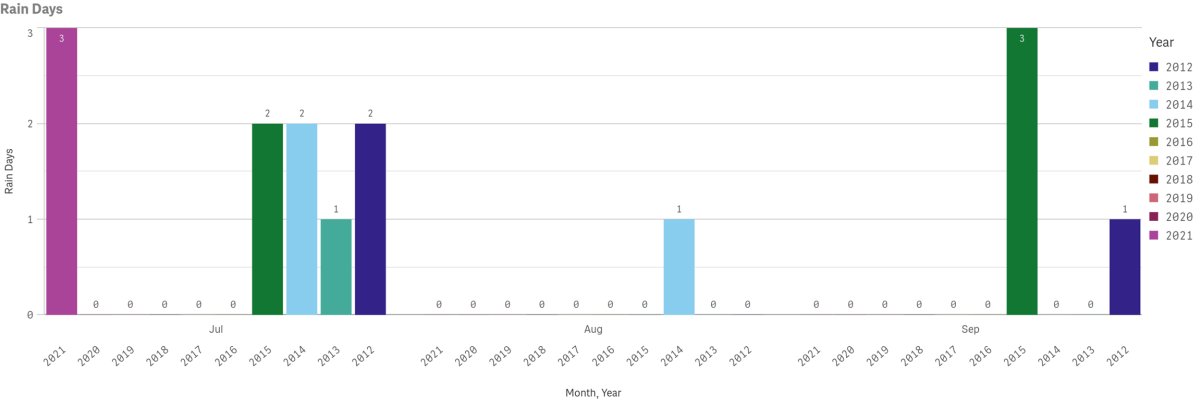
Weather
Data for August highs, lows and precipitation going back to 2012 is displayed below. Multi-year rain days data is also displayed by year and month. Measures are taken at Avalon Harbor.


$10 Off Catalina Island Ferry
Onboard Catalina Flyer
Hop onboard the Catalina Flyer for daily ferry service from Newport Beach to Avalon, Catalina Island in just over 1 hour.

Submarine & Inside Land Tours
Catalina Adventure Tours
Book Direct & Save! Tours offered multiple times daily, Submarine tours depart from Green Pier & Inside Land Tours from the Mole.

