
March 2024
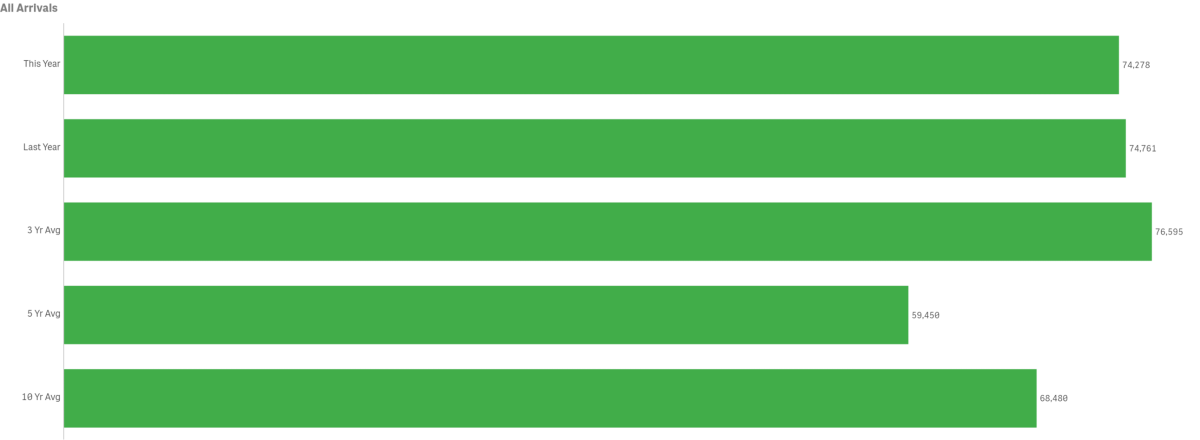
March visitation decreased year-over-year by 0.6% or 483 visitors with 74,278 arrivals. 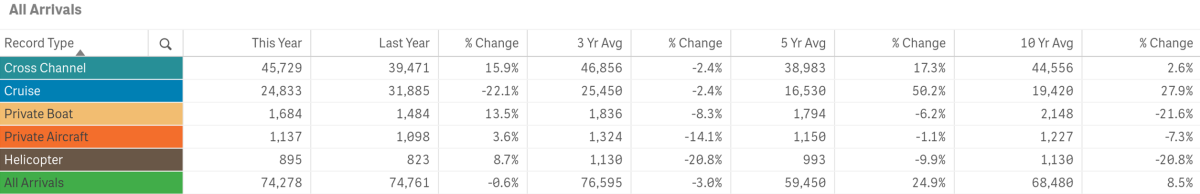
March’s total in-bound passenger count was below the three-year average by 3.0% but above the five and ten-year averages for the month by 24.9% and 8.5% respectively.
Previous tracking (below) for the month of February offers a comparison with and without COVID-19 impacts
Arrivals by Sea
Passengers arriving by sea, totaled 72,246, down for the month by 0.8% from last year.
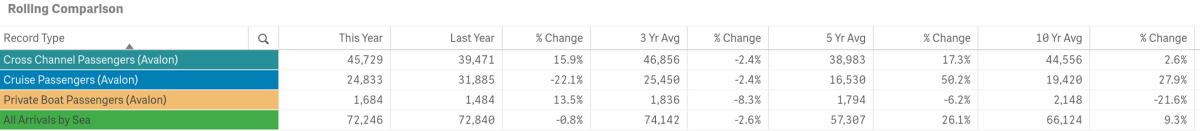
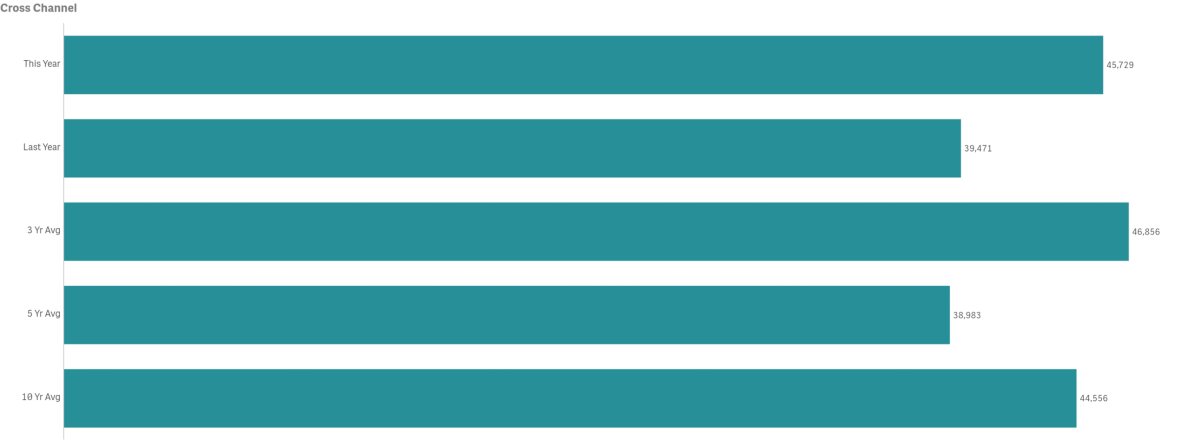
Cross Channel Passenger counts were up 15.9%, an increase of 6,258 people
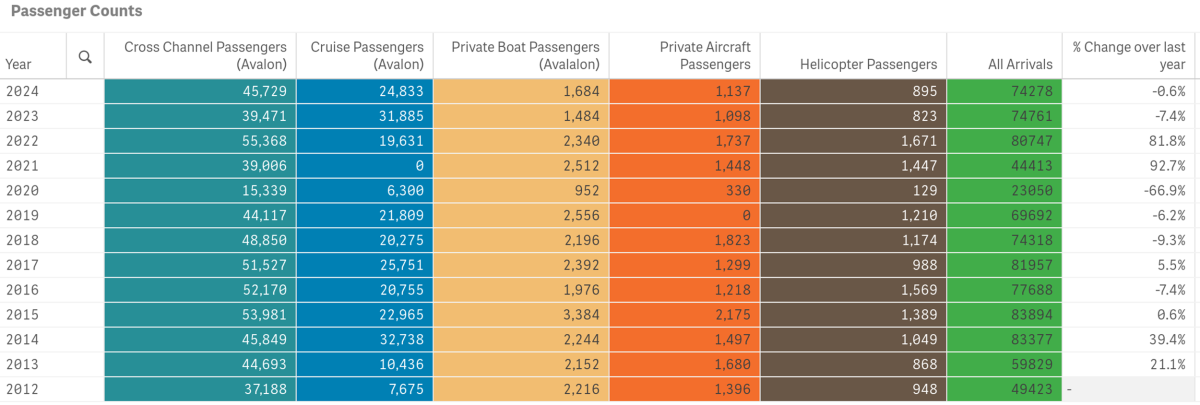
- 2022 had the highest volume for the month @ 55,368 passengers
- 2020 had the lowest volume for the month @ 15,339 passengers
- March Cross Channel Passenger counts were below the three-year average by 2.4% but above the five and ten-year averages by 17.3% and 2.6% respectively
- Cross Channel Passengers made up 61.56% of total monthly arrivals
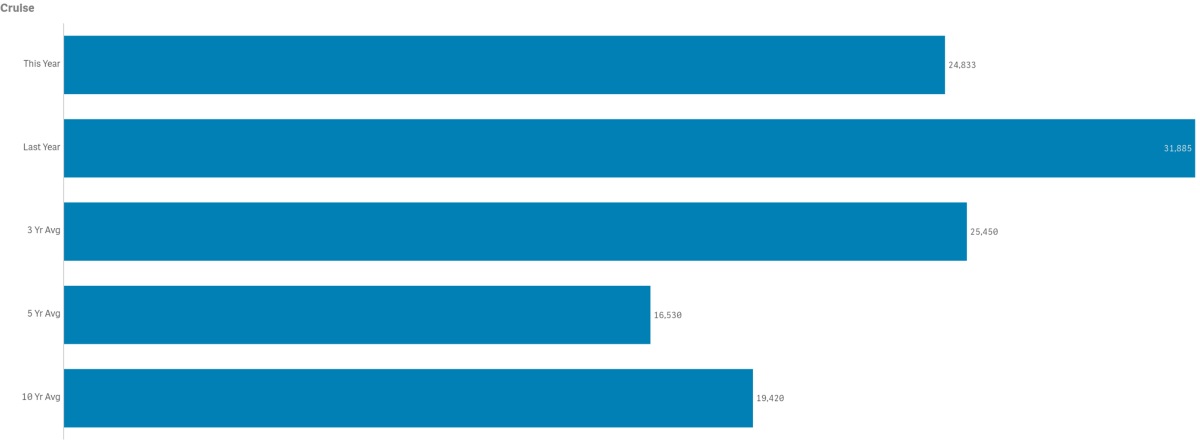
Cruise passenger counts totaled 24,833, down by 22.1% from 2023 or by 7,052 visitors
- 2014 had the highest Cruise Passenger volume for the month @ 32,738
- 2021 had the lowest Cruise Passenger volume for the month @ 0
- March Cruise Passenger counts were below the three-year average by 22.1% but above the five and ten-year averages by 50.2% and 27.9% respectively
- Cruise Passengers made up 33.43% of total monthly arrivals
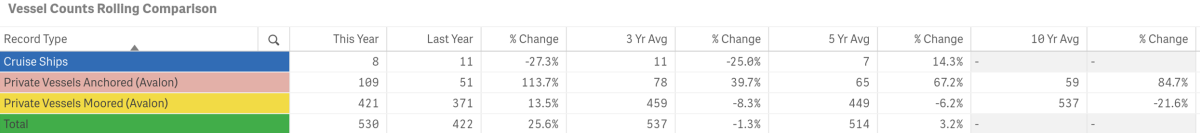
- The number of Cruise Ships calling on Avalon in March was 8
- 2022 had the highest number of ships calling @ 13
- 2021 had 0 ships calling
- March typically has 8 ships call on us
- The Vessel Counts chart above is missing ten-year averages on number of ships due to a period of time where data was only tracked annually.
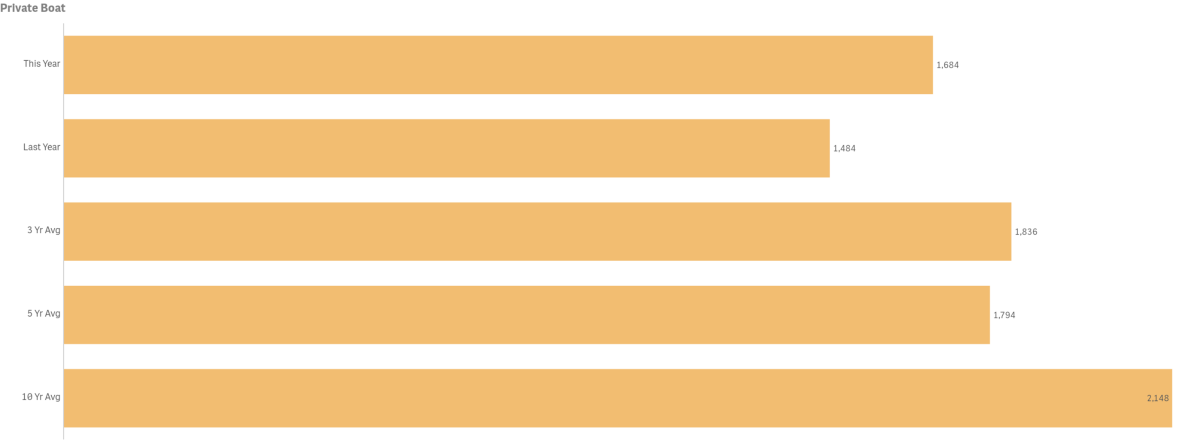
Private Boaters Passenger counts totaled 1,684, up from last year by 13.5% or 200 visitors
- 2015 had the highest passenger volume for the month @ 3,384
- 2020 had the lowest passenger volume month @ 952
- March Private Boater Passenger counts were below the three, five and ten-year averages by 8.3%, 6.2% and 21.6% respectively
- Private Boaters Made up 2.27% of total monthly arrivals
- March’s number of Vessels Anchored was up by 113.7% from last year or by 58 boats
- 2024 had the highest number of Vessels Anchored @ 109
- 2012 had the lowest number of Vessels Anchored @ 3
- March was above the three, five and ten-year averages by 39.7%, 67.2% and 84.7% respectively
- March’s number of Vessels on Moorings was up 13.5% from last year or by 50 boats
- 2021 had the highest number of Vessels on Moorings @ 628
- 2020 had the lowest number of Vessels on Moorings @ 238
- March was below the three, five and ten-year averages by 8.3%, 6.2% and 21.6% respectively
Arrivals by Air
Combined in-bound air passenger counts for March totaled 2,054, up 5.3% or 96 Arrivals from 2023. 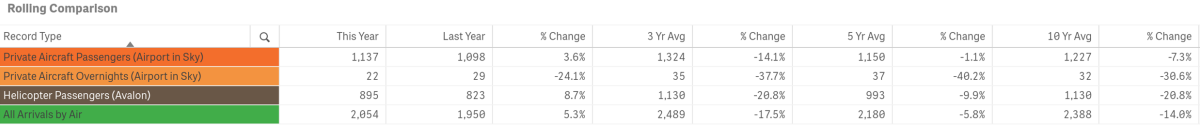
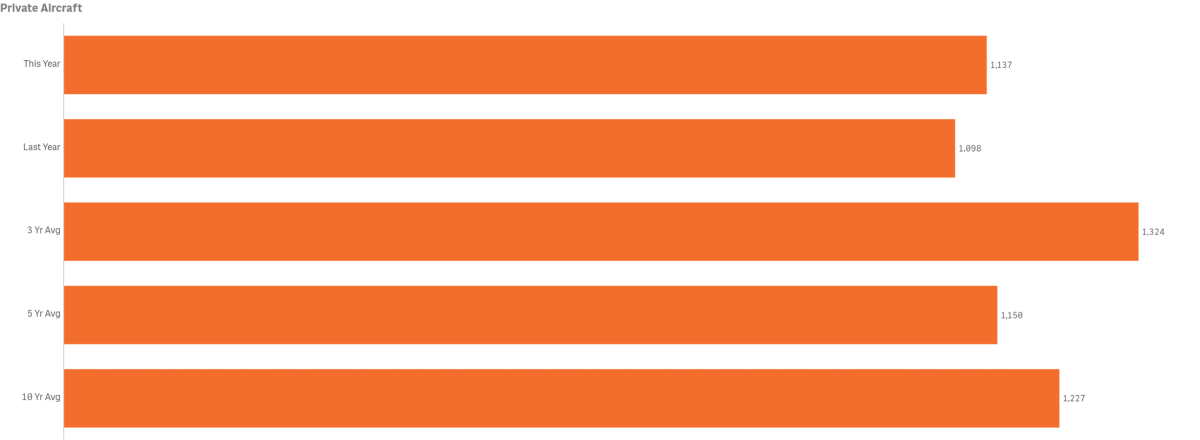
Private Aircraft Passengers (Airport in the Sky) totaled 1,137, up 3.6% or by 39 passengers vs. last year
- 2015 had the highest volume for the month @ 2,175
- 2019 the lowest volume for the month @ 0, due to airport construction
- March’s Private Aircraft Passenger count was below the three, five and ten-year averages by 14.1%, 1.1% and 7.3% respectively
- Private Aircraft Passengers made up 1.53% of total monthly arrivals
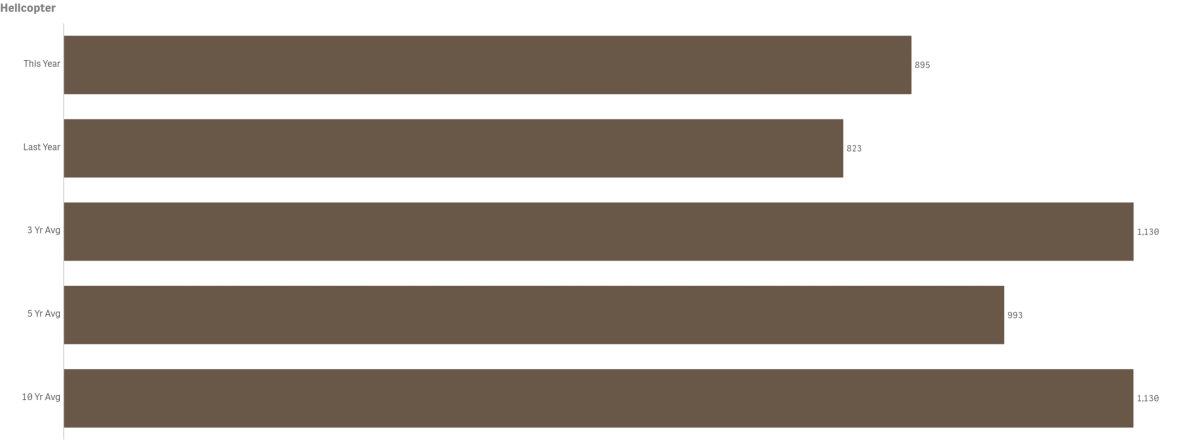
Helicopter Passenger counts totaled 895, up year-over-year by 8.7% or 72 arrivals
- 2022 had the highest volume for the month @ 1,671
- 2020 the lowest volume for the month @ 129
- March Helicopter Passenger counts were below the three, five and ten-year averages by 20.8%, 9.9% and 20.8% respectively
- Helicopter Passengers made up 1.20% of total monthly arrivals
Lodging
Hotel and Short-Term Rental Occupancy from Smith Travel and AIRDNA

- Hotel Occupancy for March was up 6.9% @ 63.5% vs. 59.4% in 2023
- Hotel Occupancy was above three, five and ten-year averages by 1.0%, 18.8% and 3.6% respectively
- 2019 had the highest Hotel Occupancy for the month @ 80.9%
- 2020 had the lowest Hotel Occupancy for the month @ 24.0%
- Visit California has not yet reported statewide Hotel Occupancy for the month
- Short-Term Rental Occupancy for March was down 4.1% @ 47.0% vs. 49.0% in 2023
- Short-term rental occupancy was below the three-year average by 7.2% but above the five and ten-year averages by 3.3% and 17.5% respectively
- 2022 had the highest Short-term Rental Occupancy for the month @ 56.0%
- 2016 had the lowest Short-term Rental Occupancy for the month @ 25.6%
- Visit California has not reported statewide Short-term Rental Occupancy for the month
- Among our competitive set, Hotels ranked in 9th position and Short-Term Rentals 10th, or last place in Occupancy (high to low)
Competing Destination Occupancies

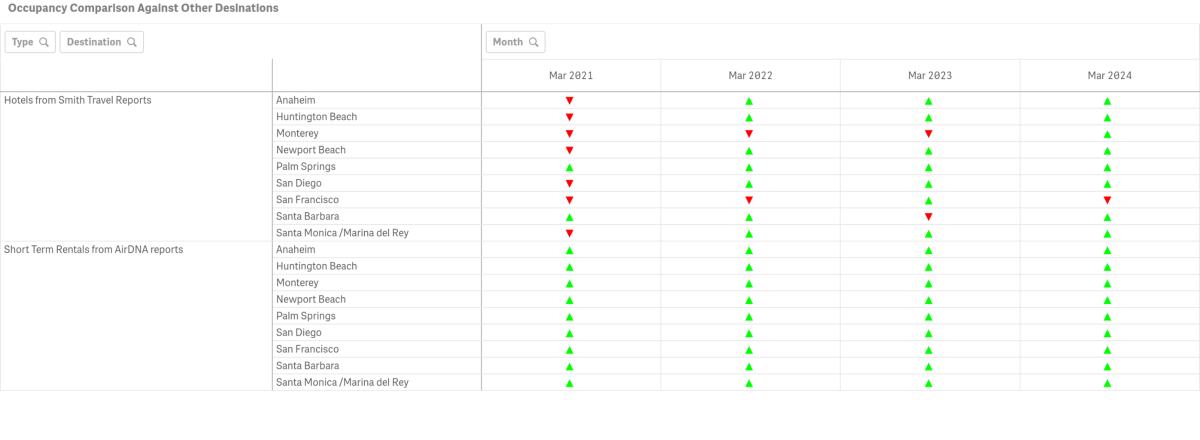
- Hotel Occupancy was higher than Catalina’s in all but San Francisco
- Short-Term Rental Occupancy was higher than Catalina’s in all competing markets
Hotel and Short-Term Rental Average Daily Rate from Smith Travel and AIRDNA

- Hotel Average Daily Rate was down 3.3% @ $197.61 vs. $204.42 in 2023
- Short-Term Rental Average Daily Rate was up by 25.1% @ $652.00 vs. $521.00 in 2023
- Among our competitive set, Catalina ranked 10th in Average Daily Rate for Hotels and 1st for STRs (high to low)
- Statewide Hotel Average Daily Rate was not yet reported
- Statewide STR Average Daily Rate was not yet reported
Hotel and Short-Term Rental Revenue Per Available Room from Smith Travel and AIRDNA

- Hotel Revenue Per Available Room was up 3.3% @ $125.39 vs. $121.42 in 2023
- Short-Term Rental Revenue Per Available Room was $310.00, up 20.6% from $257.00 in 2023
- Among our competitive set, Catalina ranked 10th for hotels and STRs in Revenue Per Available Room (high to low)
- Statewide Hotel Revenue Per Available Room was not yet reported
- Statewide Short Term Rental Revenue Per Available Room was not reported
Visitors Services
Catalina Island Visitor Center

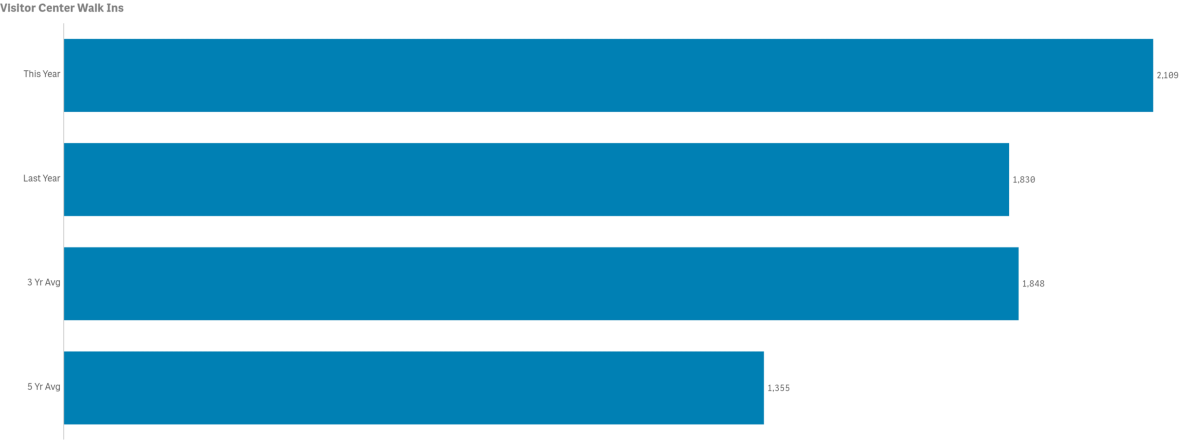
- Walk-ins for the month were up year-over-year by 15.2% @ 2,109 vs. 1,830 in 2023
- 2019 had the highest volume for the month @ 2,436
- 2020 had the lowest volume for the month @ 584
- March walk-in counts were below the three and five-year averages of by 21.9% and 2.8% respectively
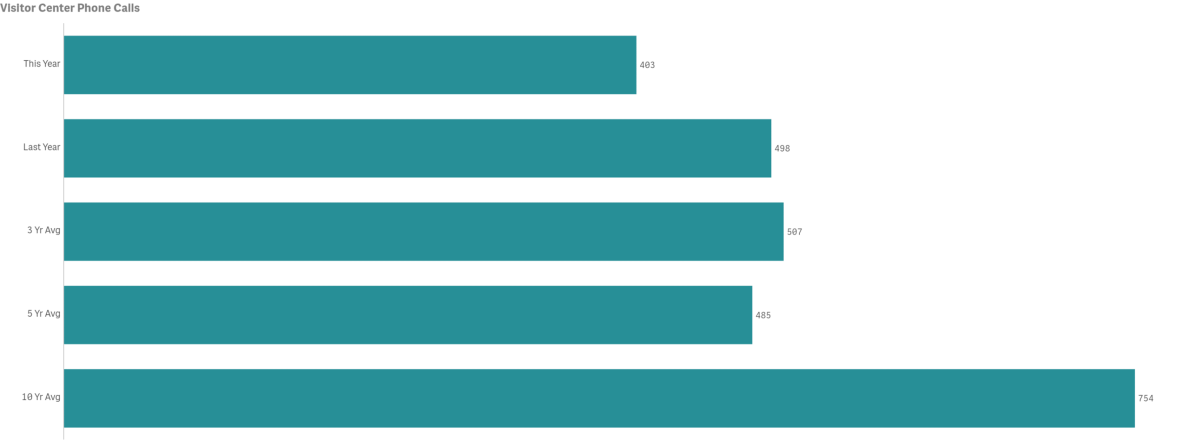
- The number of Phone Calls for the month was down by 19.1% year-over-year @ 403 vs 498
- 2007 had the highest volume of calls for the month @ 1,815
- 2021 had the lowest volume of calls for the month @ 318
- March calls were below the three, five and ten-year averages by 20.5%, 16.8% and 46.6% respectively
- Increased use of online and mobile self-help tools for reservations and research are being seen as the main reason for declining calls. Inquiries on social media and via email are often taking the place of calls as well.
LoveCatalina.com

- March LoveCatalina.com total website traffic was up year-over-year by 44.2% @ 111,000 vs 77,000 in 2023
- March total website users were above the three and five-year averages by 12.3% and 21.5% respectively
- Book Direct referrals were up year-over-year by 27.0% @ 11,734 vs. 9,243 in 2023
- Book Direct lodging searches were up 27.0% @ 11,734 vs. 9,241 in 2023
Note changes to Book Direct in 2021 resulted in shifting traffic between referrals and searches. New Google metrics inhibit ten-year reporting in our software.
Visitor Guides & Newsletters
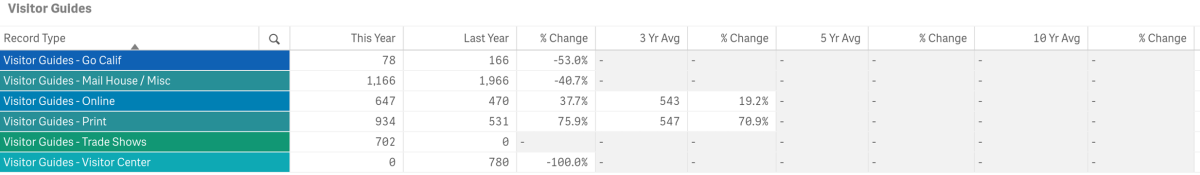
- Certified racks were filled from prior months’ deliveries
- Go California Print Guide orders totaled 78, down from 166 in 2023
- Mail House fulfillment was down 48.7% @ 1,166 vs 1,966 in 2023
- Online Guide downloads were up @ 647 vs. 470 in 2023
- Printed Visitor Guide orders on LoveCatalina.com @ 934, were up from 531 last year
- No new Visitor Guides were delivered to the Visitor Center with prior month’s supply being adequate
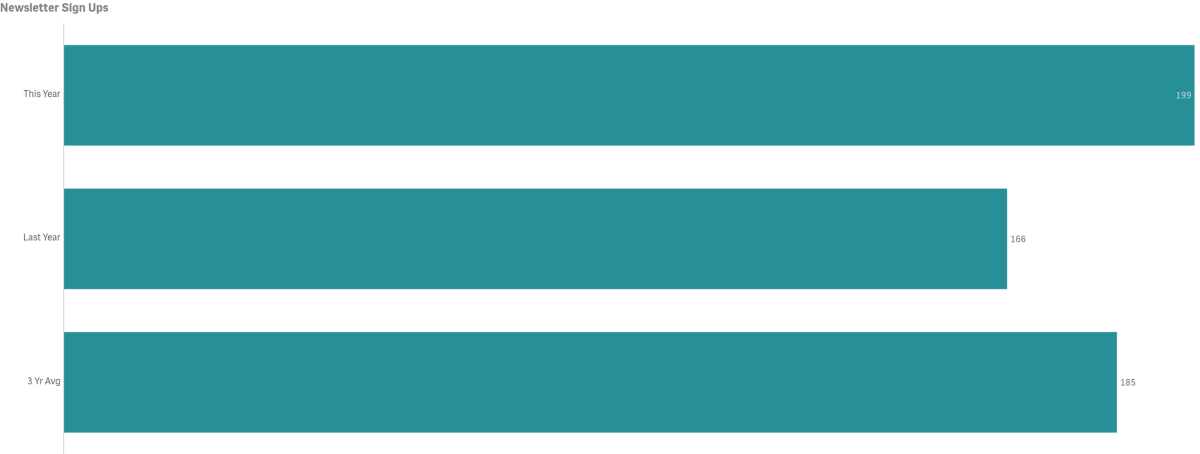
- New E-newsletter subscribers in March were up year-over-year @ 199 vs 166 in 2023
- New subscribers for the month were above the three -year average
Social Media
Cumulative totals by platform as of March below
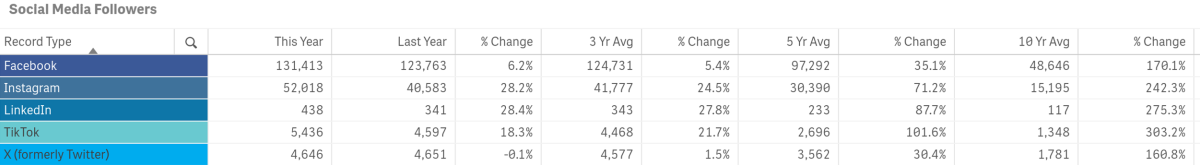
- Facebook followers are up year-over-year by 6.2%
- Instagram followers are up year-over-year by 28.2%
- LinkedIn followers are up year-over-year by 28.4%
- TikTok is up year-over-year by 18.3%.
- X followers are flat year-over-year
Year-to-date and Historical Arrivals

COVID-19 and pre-Covid-19 comparrison data is illustrated in the snapshot above (January – March)
Below is a graph of year-to-date and mutli-year comparissons of all arrivals by sector
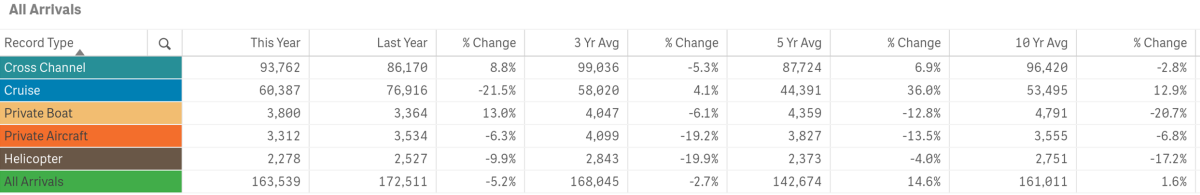
- 2024 year-to-date total visitation is 89,261, down 5.2% from 172,511 last year
- 2024 year-to-date visitation is below the three-year average by 2.7% but above the five and ten-year averages by 14.6% and 1.6% respectively
To view historical data for total arrivals by sector, year and month in a spreadsheet form click here.
Year-to-date Lodging
Hotel and Short-Term Rental Occupancy from Smith Travel and AirDNA

- Hotel Occupancy January through March 2024 was up 1.0% @ 55.6% vs.55.1% tracked for the same time period in 2023
- Short-Term Rental Occupancy was 35.0%, down 7.9% from 2023 @ 38%
- According to Smith Travel, Catalina’s average year-to-date Hotel Occupancy of 55.6% was below the YTD occupancy for all of our competing destinations
- According to AirDNA, Catalina’s average Short-Term Rental year-end Occupancy of 35.0% was below all destinations in our competitive set
Year-to-date Visitor Services
Catalina Island Visitor Center

- The number of Phone Calls year-to-date are down by 17.3% @ 996 vs. 1,205 in 2023
- Year-to-date Phone Calls were below the three, five and ten-year averages by 19.6%, 17.8% and 44.1% respectively
- Number of Walk-Ins year-to-date are down @ 4,593 vs. 4,665 or 1.5%
- Year-to-date Walk-In counts were below the three-year average by 0.2% but above the five-year average by 32.7%
Year-to-date LoveCatalina.com

- Book Direct Package referrals were not active this reporting period
- Book Direct referrals are up by 13.4% year-to-date @ 28,256 vs. 24,916 in 2023
- Book Direct lodging searches were up by 33.0% @ 43,297 vs. 32,559 in 2023
- LoveCatalina.com website users are up for the period by 30.1% @ 281,000 vs.216,000 in 2023
Note changes to Book Direct on member links has resulted in shifting some traffic to referrals vs. searches and Google website traffic reporting has moved to G4 effective July 2022
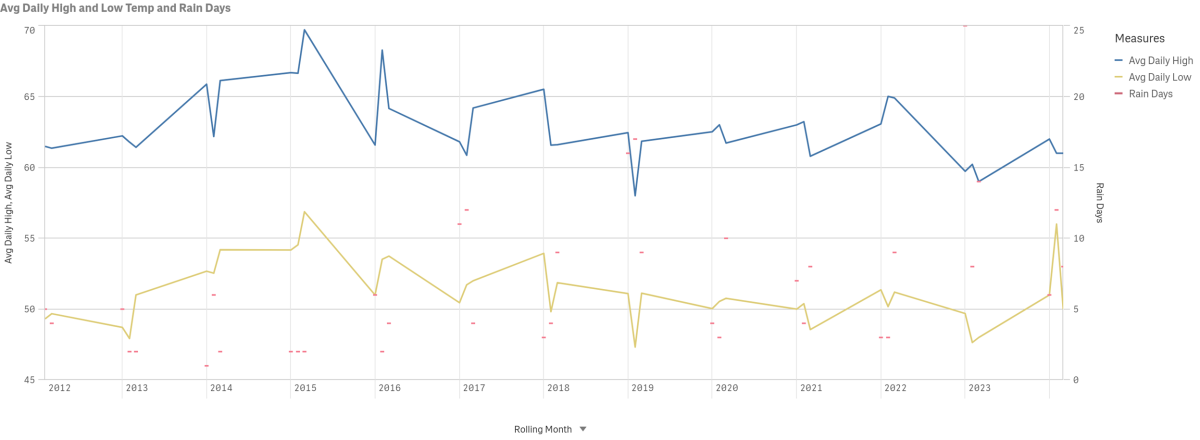
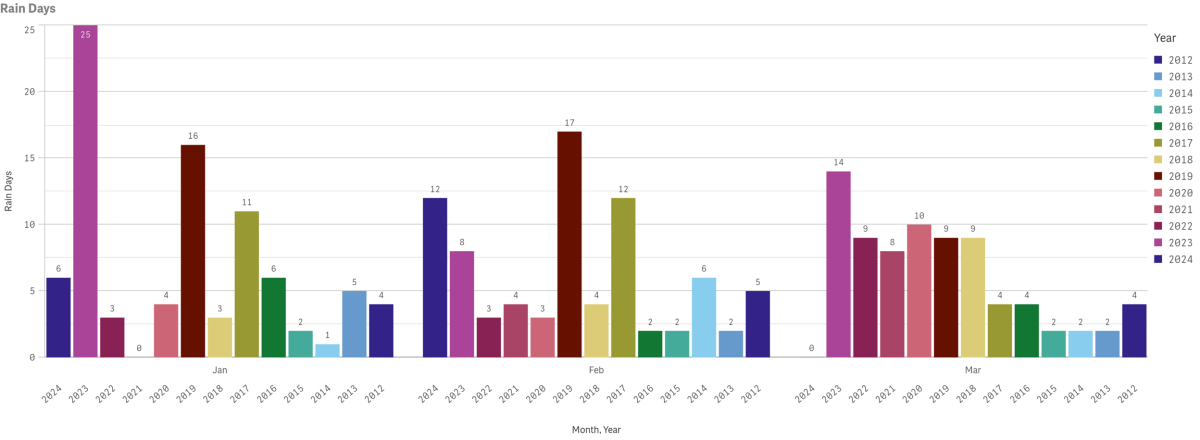
Weather
Multi-year temperature and rain days by month (January-March) are displayed below. Measures are taken at Avalon Harbor.


Catalina Flyer from Newport
$10 Off Catalina Island Ferry
Hop onboard the Catalina Flyer for daily ferry service from Newport Beach to Avalon, Catalina Island in just over 1 hour.

Catalina Sea Spa
Recharge with massages starting at $110.
Discover Bliss at Catalina Sea Spa! Book online or call 310-510-8920. Treat yourself and escape to relaxation today!

