
March 2021
March reflected the ongoing impacts of COVID-19 but showed significant signs of recovery. Mid-March 2020 was when COVID-19 based limitations on travel were initially imposed.
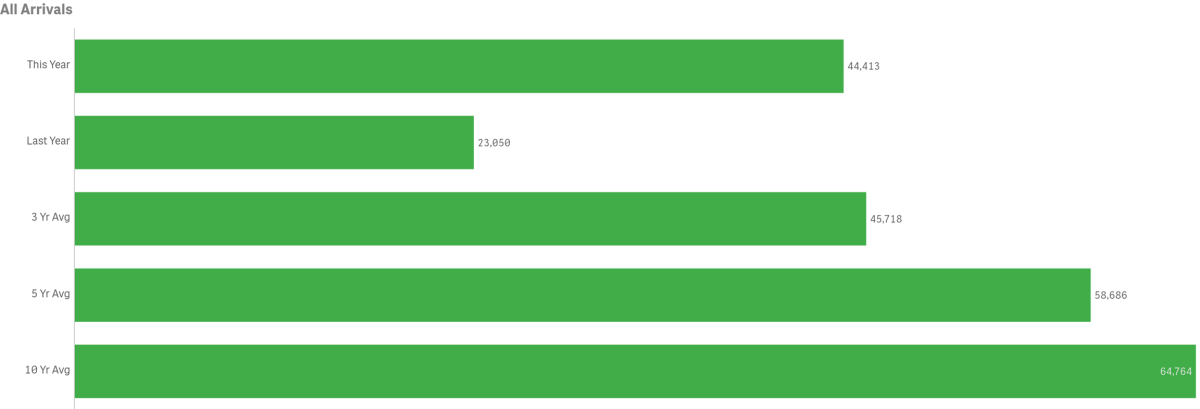
All Arrivals
March visitation increased year-over-year in four sectors (cross channel, private boaters, private aircraft and helicopter), resulting in an overall increase by 21,363 visitors over the same month last year.
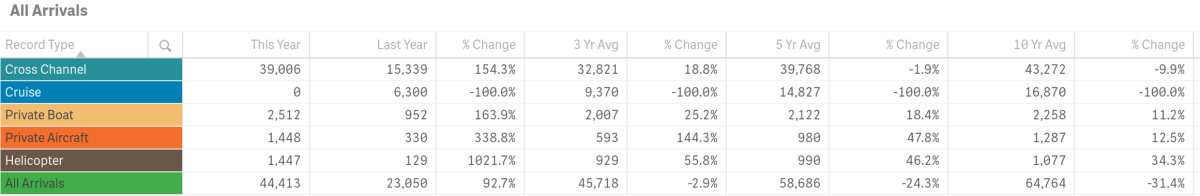
March’s total in-bound passengers = 44,413, up 92.7% from last year @ 23,050. March 2021 was below the three-year average of 45,718 by 2.9%. March was below the five-year average of 58,686 by 24.3% and the ten-year average of 64,764 by 31.4%.
Arrivals by Sea
Passengers arriving by sea, including private boaters, was 41,518 for the month of March, up 83.8% from 22,591 last year.
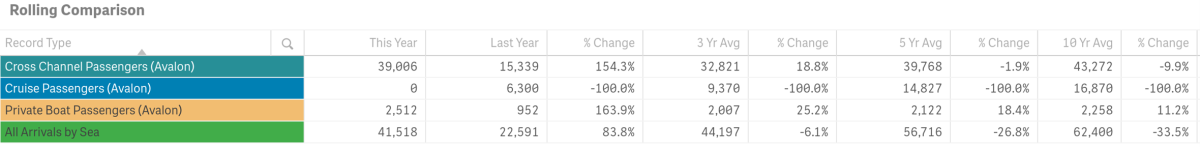
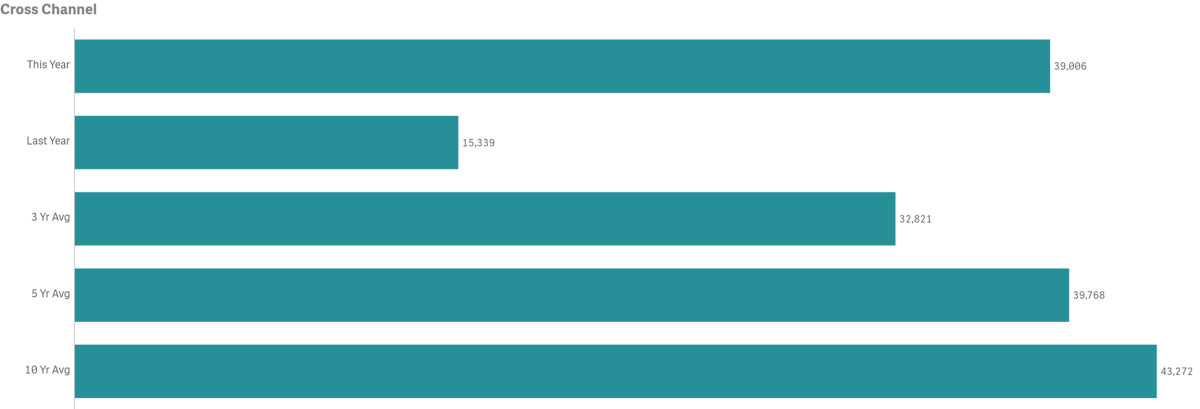
- March Cross Channel passenger counts were up 154.3% year-over-year @ 39,006 vs.15,339 last year
- 2015 had the highest volume for the month @ 53,981 passengers
- 2020 had the lowest volume for the month @ 15,339. Pre-COVID19 the lowest count for the month was in 2011 @ 27,397
- March Cross Channel passenger counts were above the three-year average of 32,821 by 18.8%
- March Cross Channel passenger counts were below the five-year and ten-year averages of 39,768 and 43,272 respectively
- Cross Channel Carriers made up 87.83% of total monthly arrivals
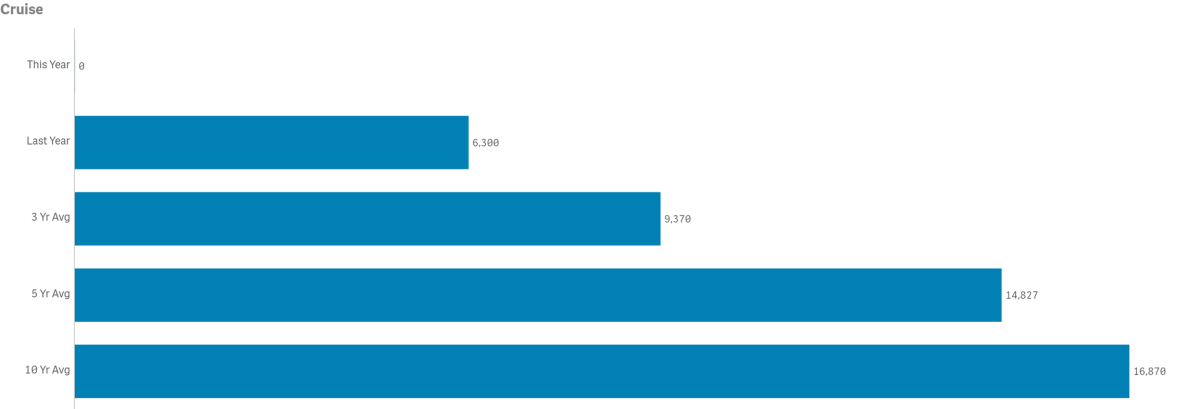
- Cruise passenger counts were down 100% year-over-year @ 0 vs. 6,300 in 2020
- 2014 had the highest cruise passenger volume for the month @ 32,738
- 2021 had the lowest cruise passenger volume for the month @ 0. Previous low was 1995 @ 4,819
- March cruise passenger counts were below the three-year average of 9,378 by 100%
- March cruise passengers counts were below the five-year and ten-year averages of 14,827 and 16,870 respectively
- Cruise passengers made up 0% of total monthly arrivals
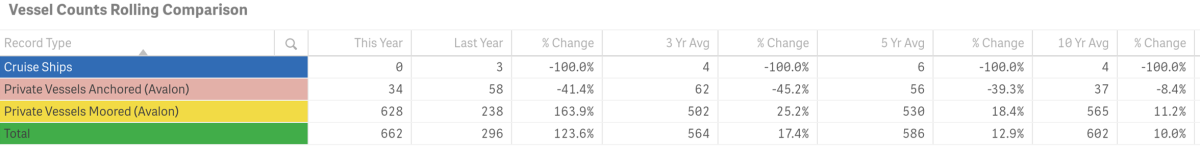
- The number of Cruise Ships calling on Avalon was down @ 0 vs. 3 in 2020
- 2016 and 2019 had the highest number of cruise ships in port @ 9
- 2021 had the lowest number of cruise ships in port @ 0. Previous low was 2017 and 2018 @ 8
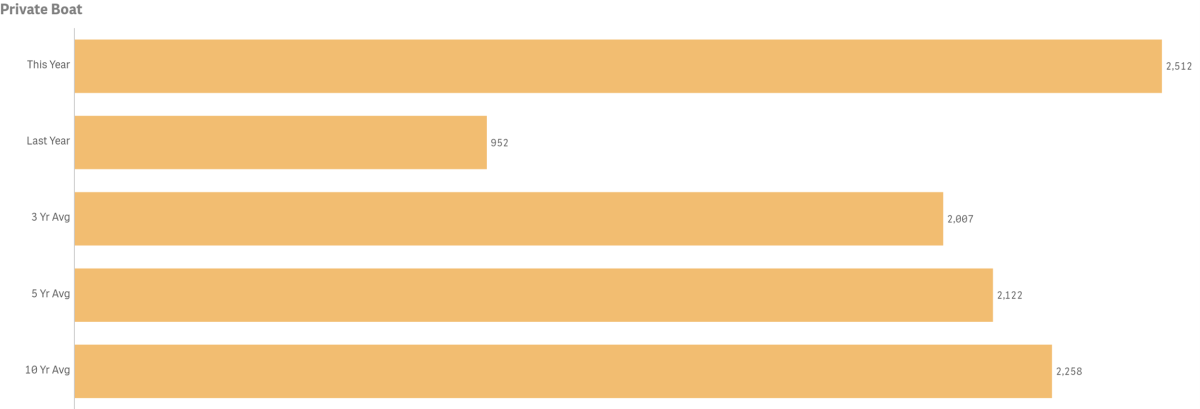
- Private Boater passenger counts were up year-over-year by 163.5% @ 2,512
- 2015 had the highest passenger volume for the month @ 3,384
- 2020 had the lowest passenger volume month @ 952
- March private boater passenger counts were above the three-year average of 2007 by 25.2%
- March private boater passenger counts were above the five-year and ten-year average by 18.4% and 11.2% respectively
- March number of boats on anchor was down by 41.4% @ 34 vs. 58 last year
- 2019 had the highest number of vessels at anchor @ 94
- 2012 had the lowest number of vessels at anchor @ 3
- March number of boats on moorings was up 163.9% @ 628 vs. 238 last year
- 2015 had the highest number of vessels on moorings @ 846
- 2020 had the lowest number of vessels on moorings @ 238. The prior lowest count was in 2016 @ 494
- Private Boaters Made up 5.66% of total monthly arrivals
 .
.
Arrivals by Air
Combined in-bound air passenger counts for March totaled 2,940, up by 497.6% from 2020.
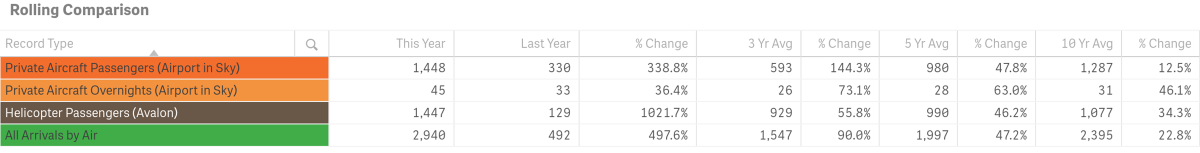
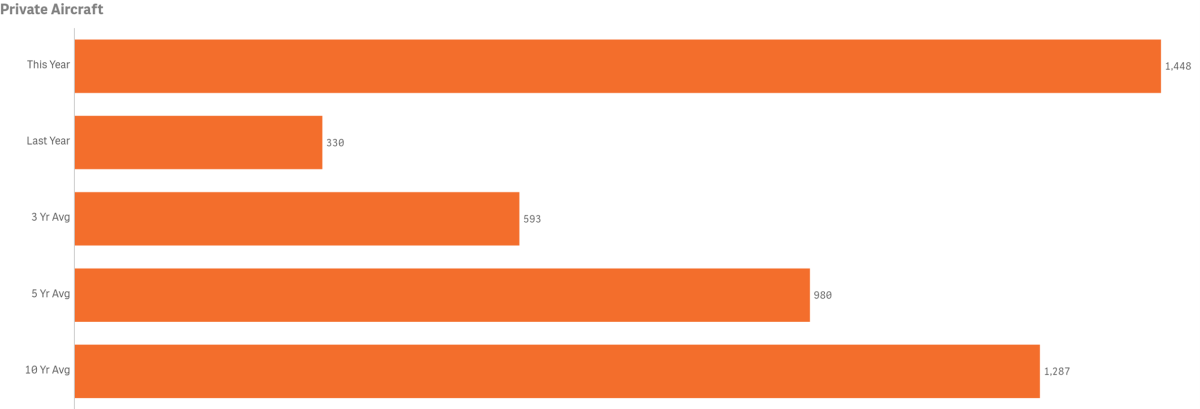
- People aboard planes (Airport in the Sky) was up 338.8% @ 1,448
- 2018 had the highest volume of private aircraft passenger counts for the month @ 1,823
- 2019 had the lowest volume of private aircraft passenger counts for the month @ 0, (construction) while 2020 had the lowest volume when open @ 330
- March counts for people aboard planes was above the three-year average of 593 by 144.3%
- March counts for people aboard planes was above the five-year and ten-year averages by 47.8% and 12.5% respectively
- March people aboard planes made up 3.26% of total monthly arrivals
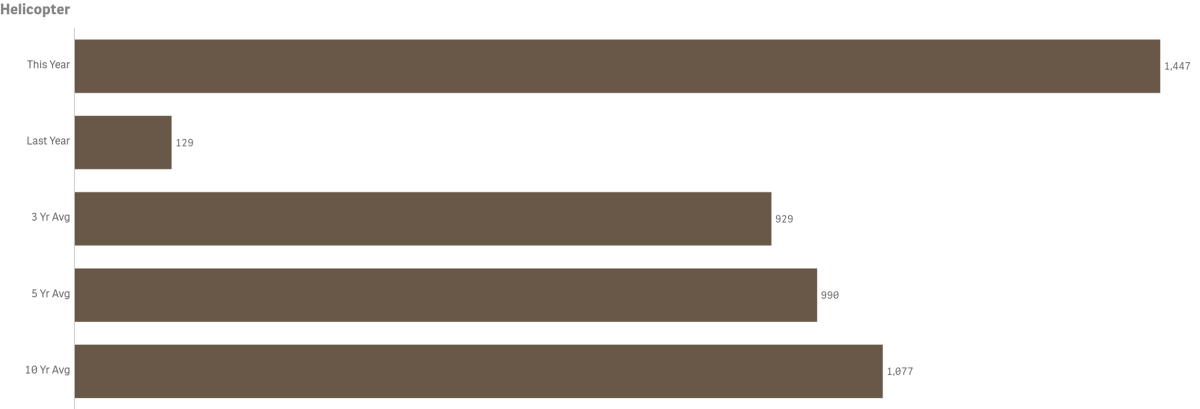
- People aboard Charter Helicopters was up year-over-year by 1.027% @ 1,447 vs.129
- 2018 had the highest volume for the month @ 1,399
- 2020 had the lowest volume for the month @ 0.
- March counts for people aboard helicopters was above the three-year average of 929 by 55.8%
- March counts for people aboard helicopters was above the five-year and ten-year averages by 46.2% and 14.3% respectively
- March people aboard Helicopters made up 3.26% of total monthly arrivals
Year-to-Date
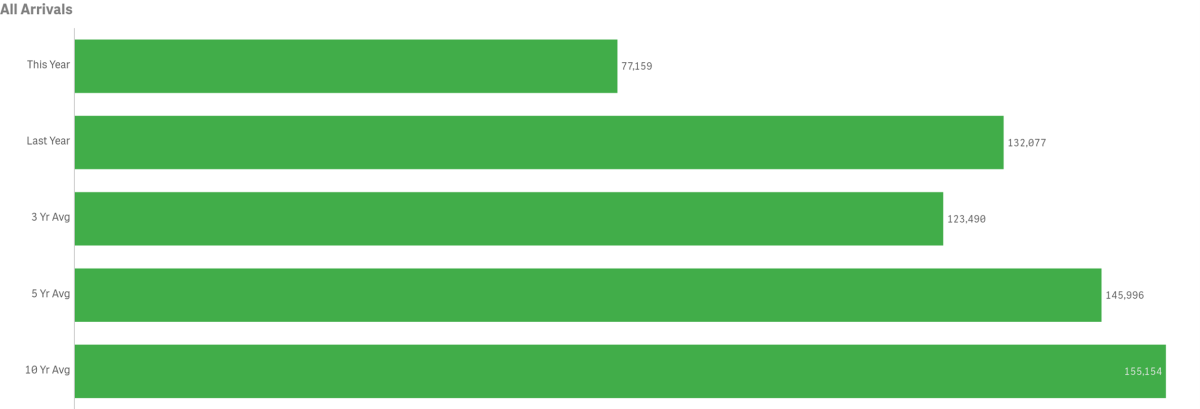
Total year-to-date arrivals are down 41.6%
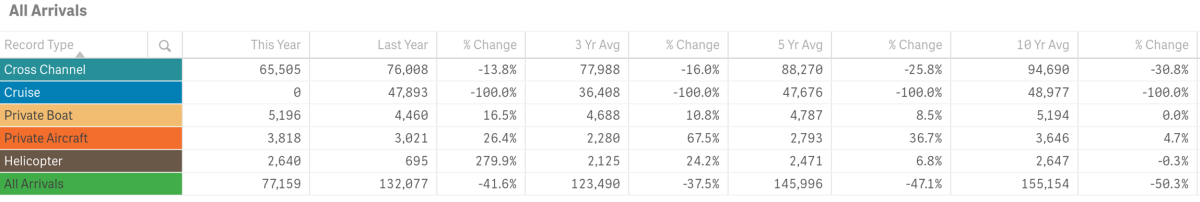
- Total arrivals year-to-date was down from last year @ 77,159 vs. 132,077 or a difference of 54,918 visitors
- Total arrivals year-to-date fell below the three, five and ten year averages by 37.5%, 47.1% and 50.3% respectively
- Private Boaters, Private Aircraft and Helicopter arrivals are up while Cross Channel and Cruise are down year-to-date
To view historical data for total arrivals by sector, year and month in a spreadsheet form click here. PDF File.
Visitor Services

Catalina Island Visitor Center
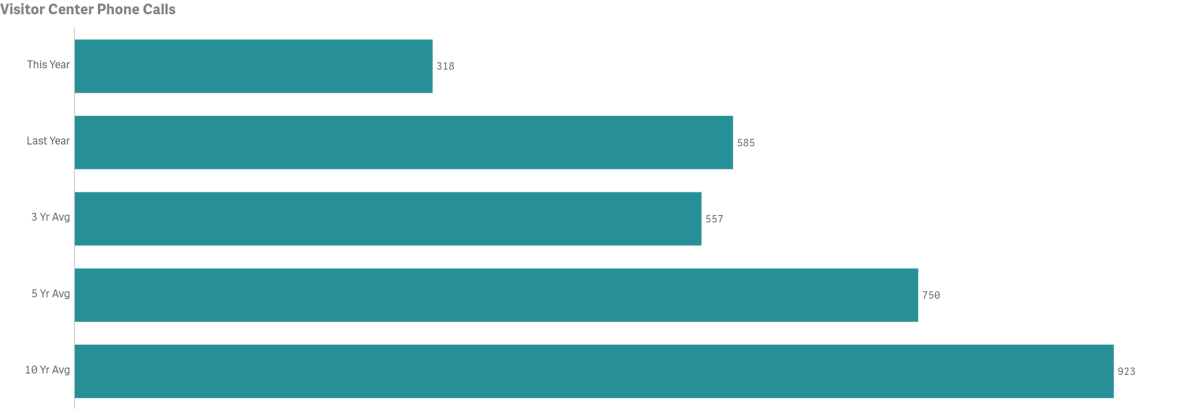
- Number of calls for the month was down year-over-year by 45.6% @ 318 vs. 585
- 2007 had the highest volume for the month @ 1,815 calls
- 2021 had the lowest volume for the month @ 318 calls
- March call counts were below the three-year average of 557 by 42.9%
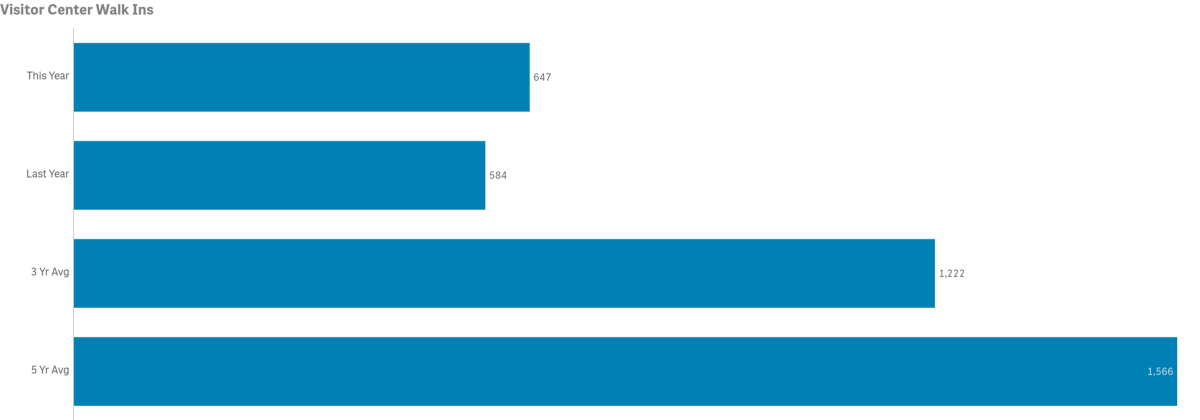
- Number of Walk-Ins for the month was up year-over-year by 10.8% @ 647 vs. 584. In March the Visitor Center was closed two days a week due to limited visitor volume.
- 2019 had the highest volume for the month @ 2,436 guests
- 2020 had the lowest volume for the month @ 584 guests
- March Walk-Ins counts were below the three-year average of 1,222 by 47.1%
LoveCatalina.com
March LoveCatalina.com Website users were 97,468 vs. 62,815 in 2020
March Printed Visitor Guide orders @ LoveCatalina.com @ 274
March Online Guide downloads @ 563
Monthly E-blast consumer sign-ups @ 170
Monthly Book Direct lodging searches 19,586
Monthly Book Direct referrals 15,027
Monthly Book Direct Package referrals are currently unavailable
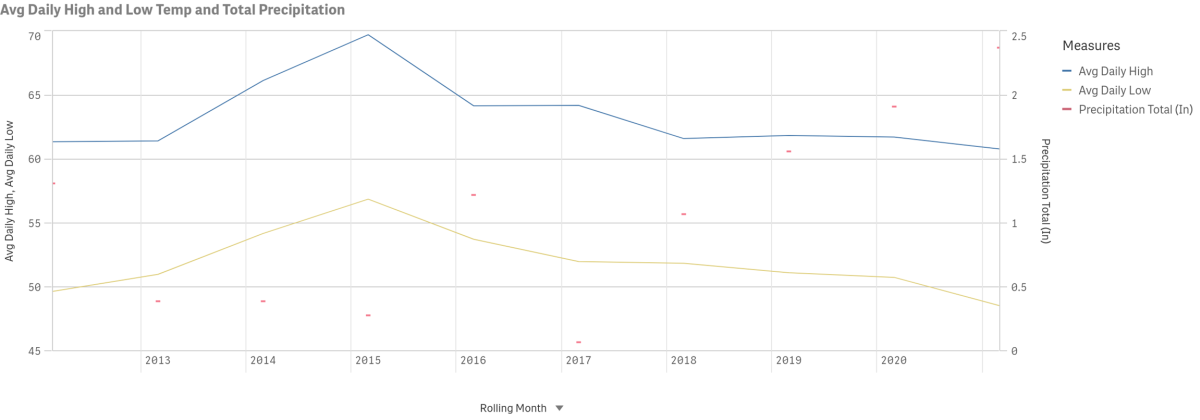
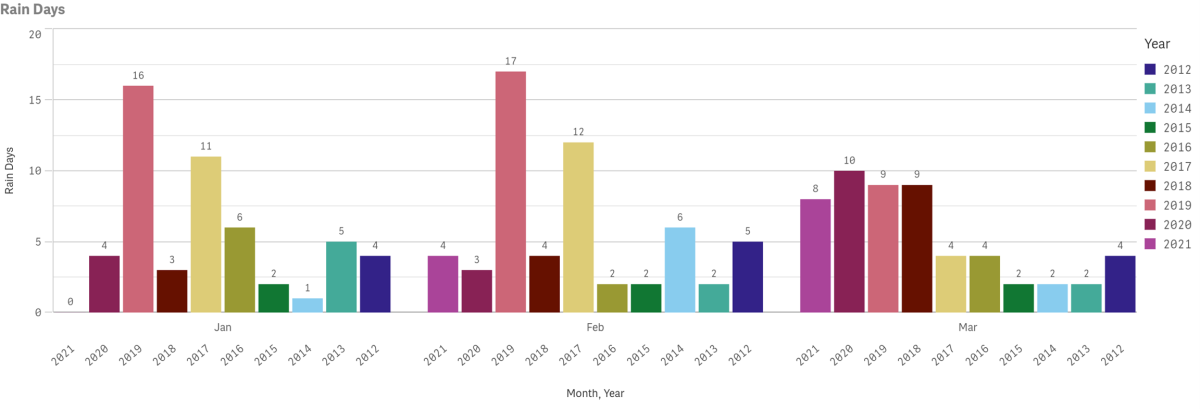
Weather
Data for March highs, lows and precipitation going back to 2012 is displayed below. Multi-year rain days data is also displayed by year and month. Measures are taken at Avalon Harbor.


Catalina Flyer from Newport
$10 Off Catalina Island Ferry
Hop onboard the Catalina Flyer for daily ferry service from Newport Beach to Avalon, Catalina Island in just over 1 hour.

Catalina Sea Spa
Recharge with massages starting at $110.
Discover Bliss at Catalina Sea Spa! Book online or call 310-510-8920. Treat yourself and escape to relaxation today!

