
July 2019 Visitor Counts
2019 has been weak year-to-date compared to the prior year. Primary factors have been weather and facility closure. Poor weather has resulted in both Cross Channel and Cruise Ship cancellations and in fewer boaters in the harbor. Accordingly, new data sets are included for weather. The July 4th holiday fell mid-week, further impacting the monthly visitor counts.
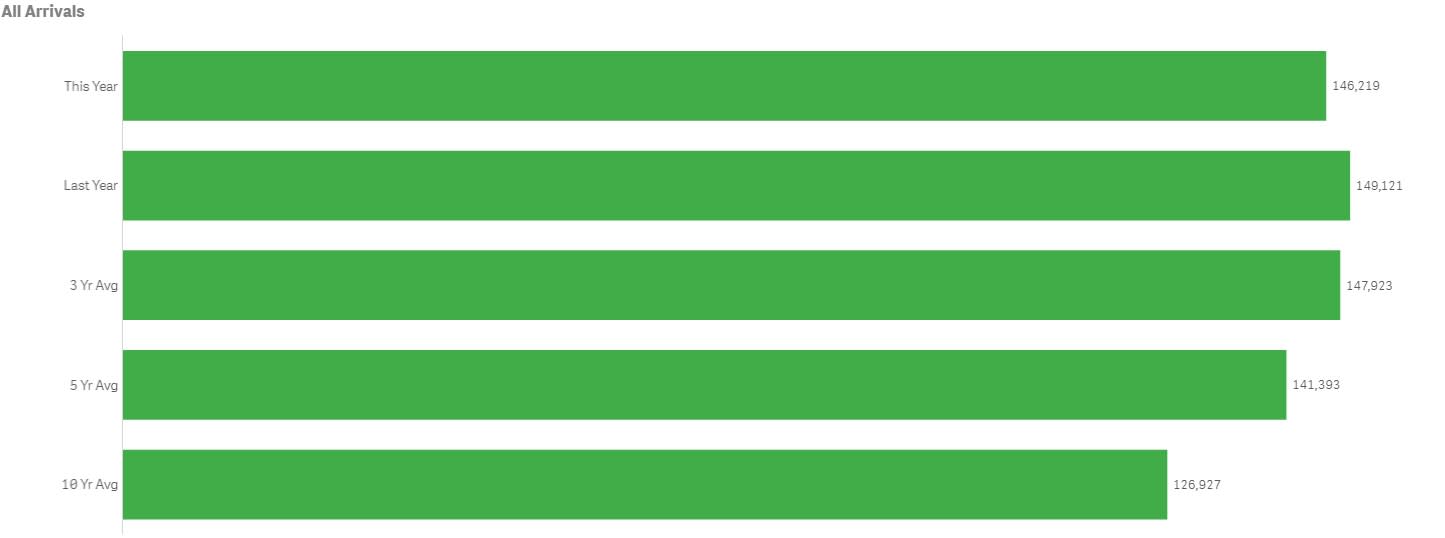
All Arrivals
July visitation increased in all but two travel sectors.
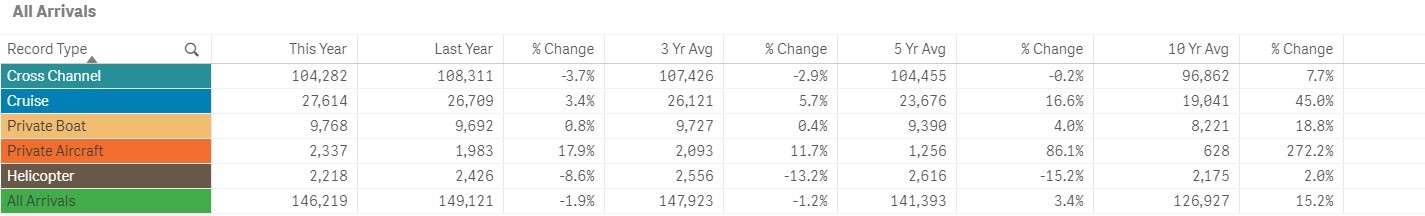
July total in-bound passengers = 146,219, down 1.9% from last year @ 149,211. July 2019 trailed the three-year average of 147,923. July exceeded the five and ten-year averages of 141,393 and 126,927, respectively.
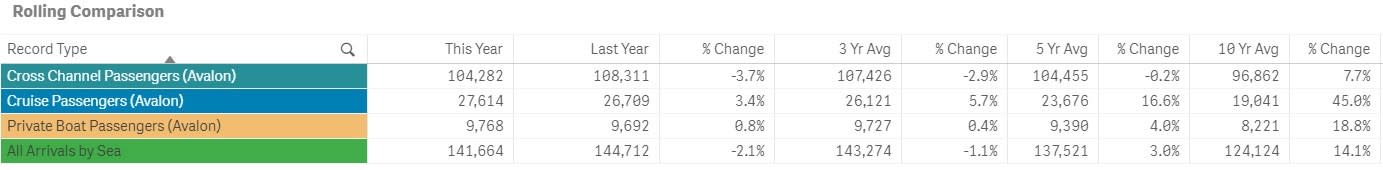
Arrivals by Sea
Avalon's combined Cruise & Cross Channel in-bound passenger counts for July totaled 131,896, down 2.31% from 2018. Total people arriving by sea, including private boaters, was 141,664 for the month, down 2.1% from 144,712 last year.
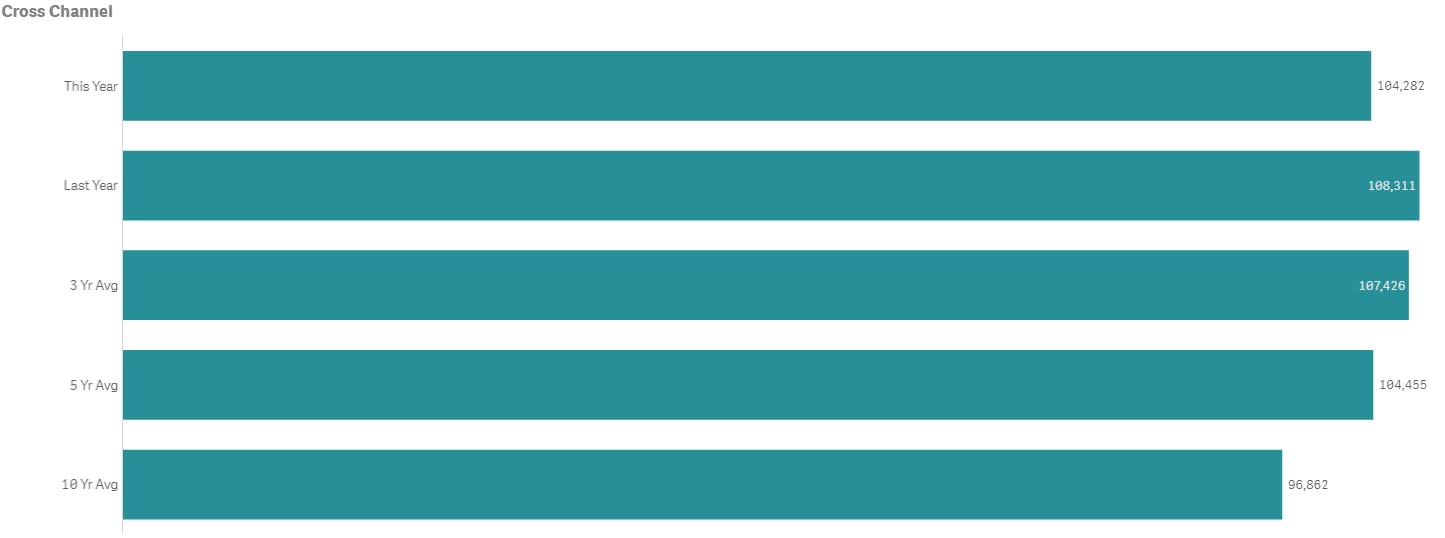
- July Cross Channel passenger counts were down 3.7% year-over-year @ 104,282.
- 2000 had the highest volume for the month @ 117,097 passengers.
- 2009 had the lowest volume for the month @ 72,316 passengers.
- July passenger counts were below the three-year average of 107,426 by 2.9%.
- Cross Channel Carriers made up 71.32% of total monthly arrivals.
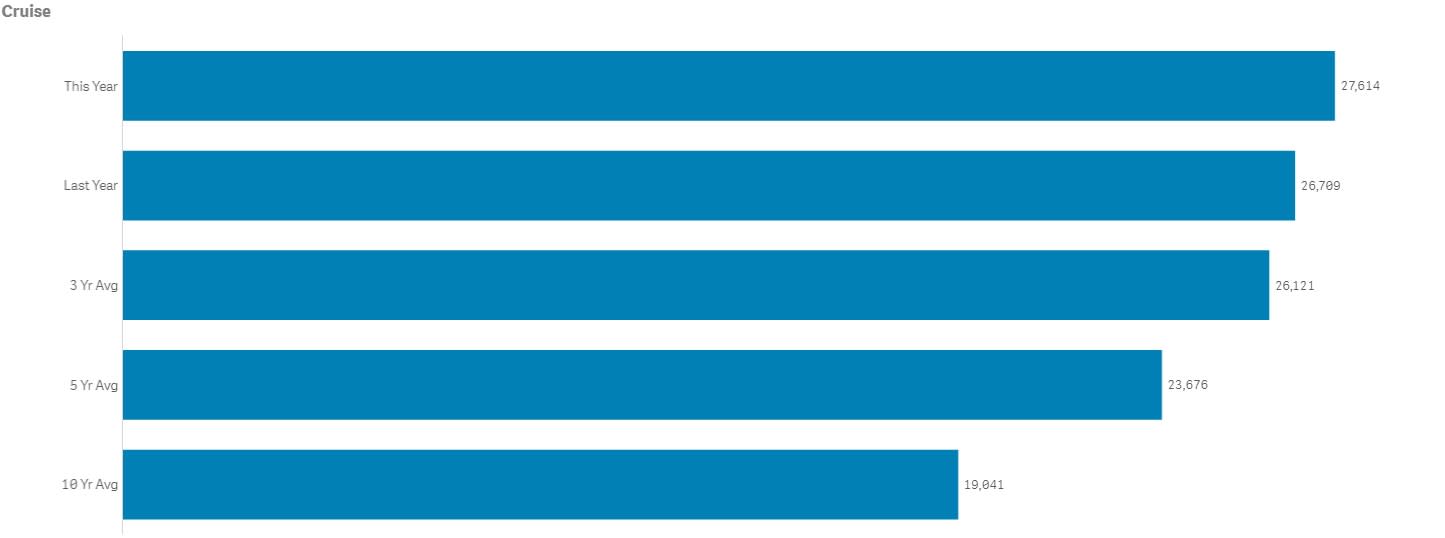
- Cruise passenger counts were up 3.4% year-over-year @ 27,614
- 2019 had the highest volume for the month @ 27,614.
- 2010 had the lowest volume for the month @ 10,512.
- July passenger counts were above the three-year average of 26,122 by 5.7%.
- Cruise passengers made up 18.89% of total monthly arrivals.
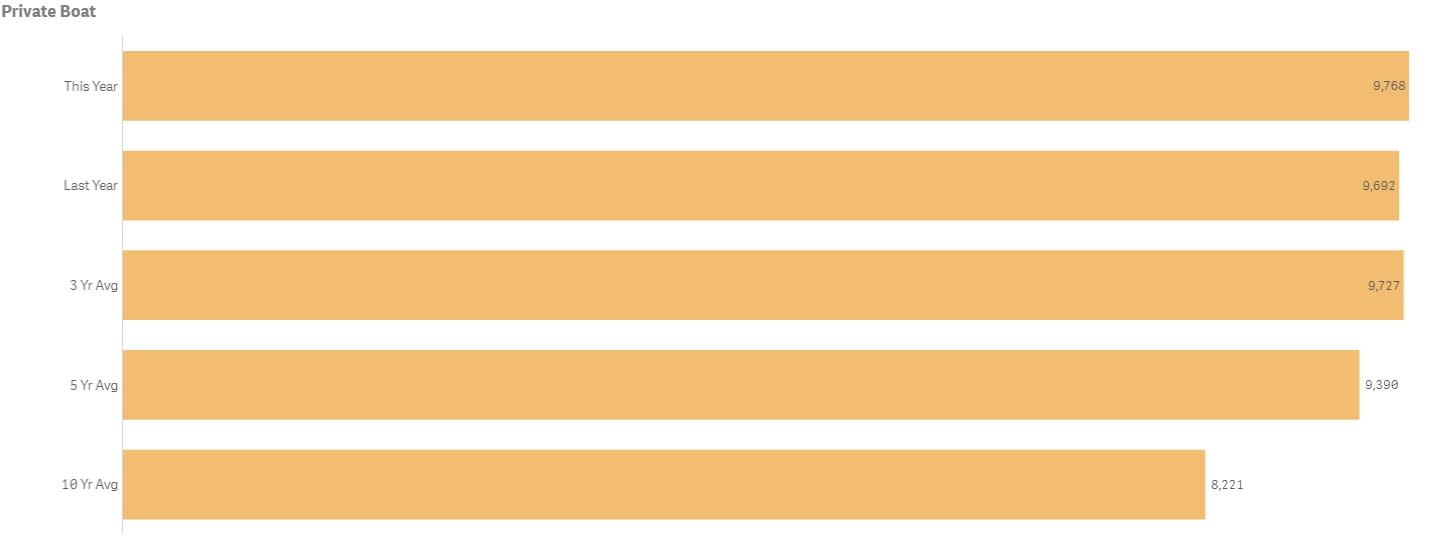
- Private Boater counts were up slightly @ 9,768
- 2019 had the highest volume for the month @ 9,768
- 2014 had the lowest volume month @ 8,084.
- July counts were above the three-year average of 9,727 by 0.4%.
- July Boaters made up 6.68% of total monthly arrivals
.
Arrivals by Air
Avalon's combined in-bound air passenger counts for July totaled 4,681, up 4.3% from 2018.
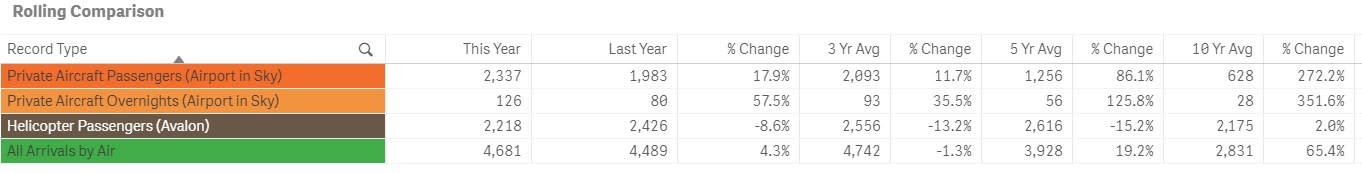
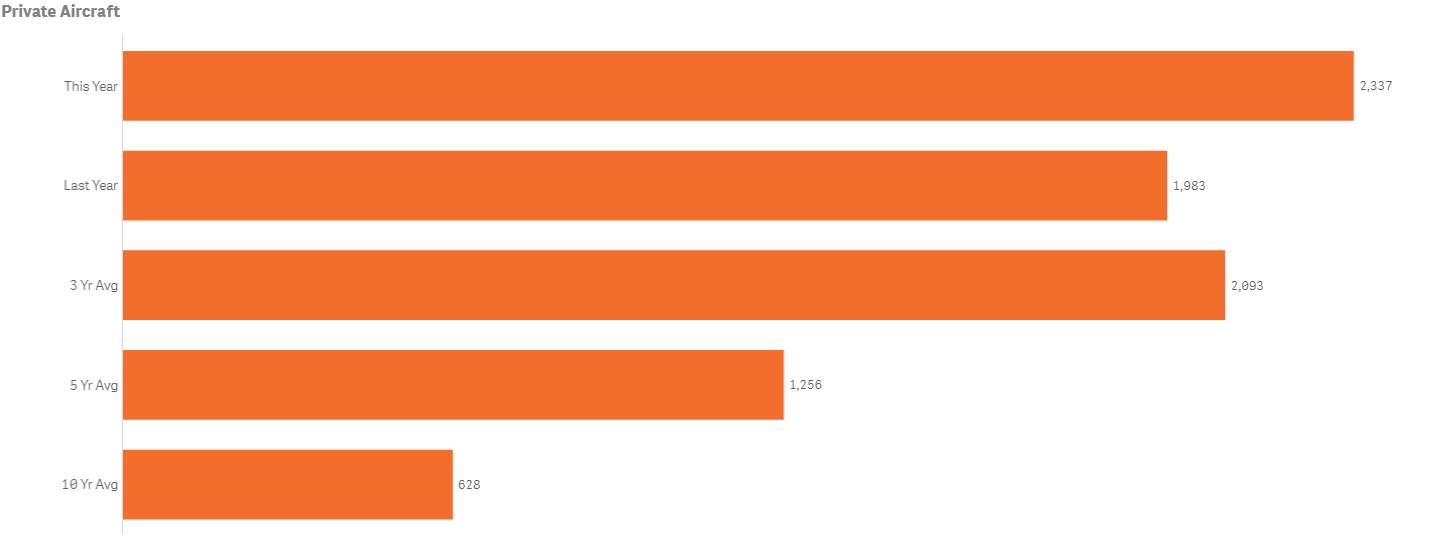
- People aboard planes (Airport in the Sky) was up 17.9% year-over-year @ 2.337.
- 2019 had the highest volume in current data, for the month @ 2,337.
- June counts were below the three-year average of 2,556 by 13.2%.
- July people aboard planes made up 1.6 % of total monthly arrivals.
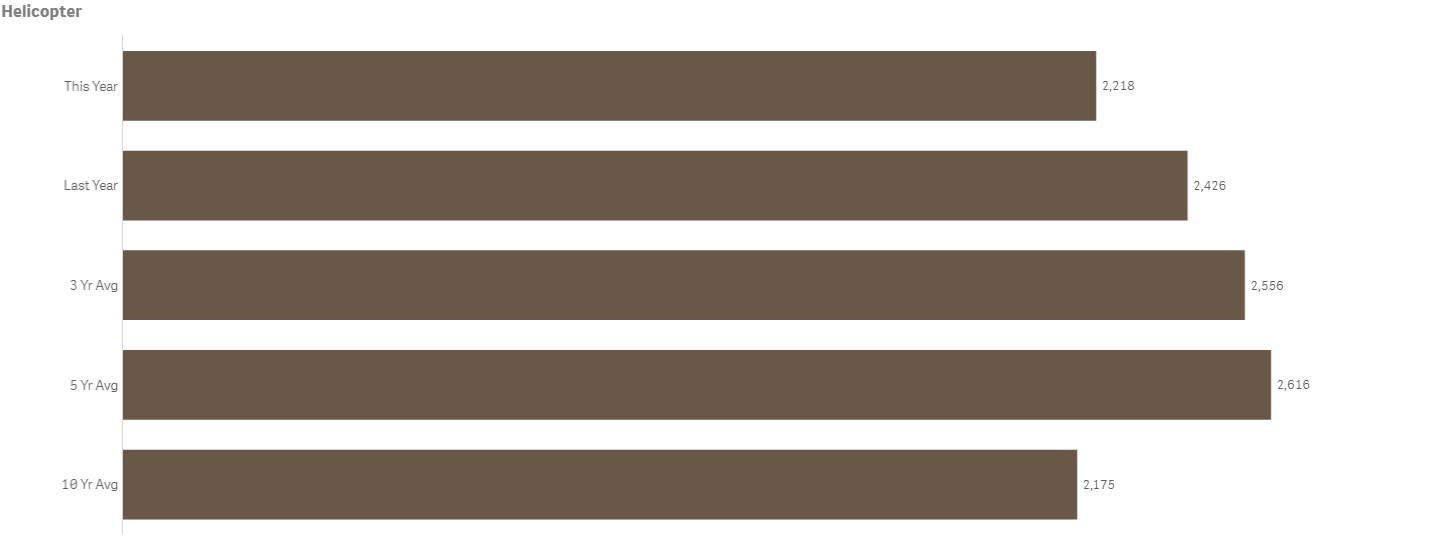
- People aboard Charter Helicopters was down year-over-year 8.6% @ 2,218.
- 2017 had the highest volume in current data, for the month @ 3,025.
- 2013 had the lowest volume in current data, for the month @ 1,932.
- July people aboard Helicopters made up 1.5% of total monthly arrivals.
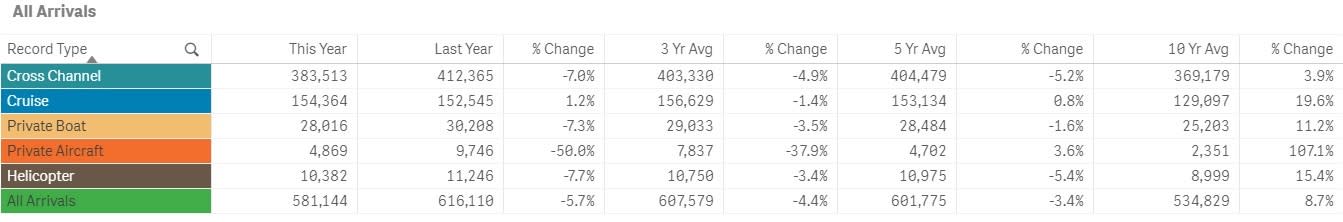
- Year-to-date total arrivals = 581,144 down 5.8% from last year which was 616,110.
- Year-to-date total arrivals is below the three-year average of 607,579 by 4.4%.
Note on year to date totals: the Airport in the Sky was closed January through May for runway repairs.
To view historical data for total arrivals by sector, year and month in a spreadsheet form click here.
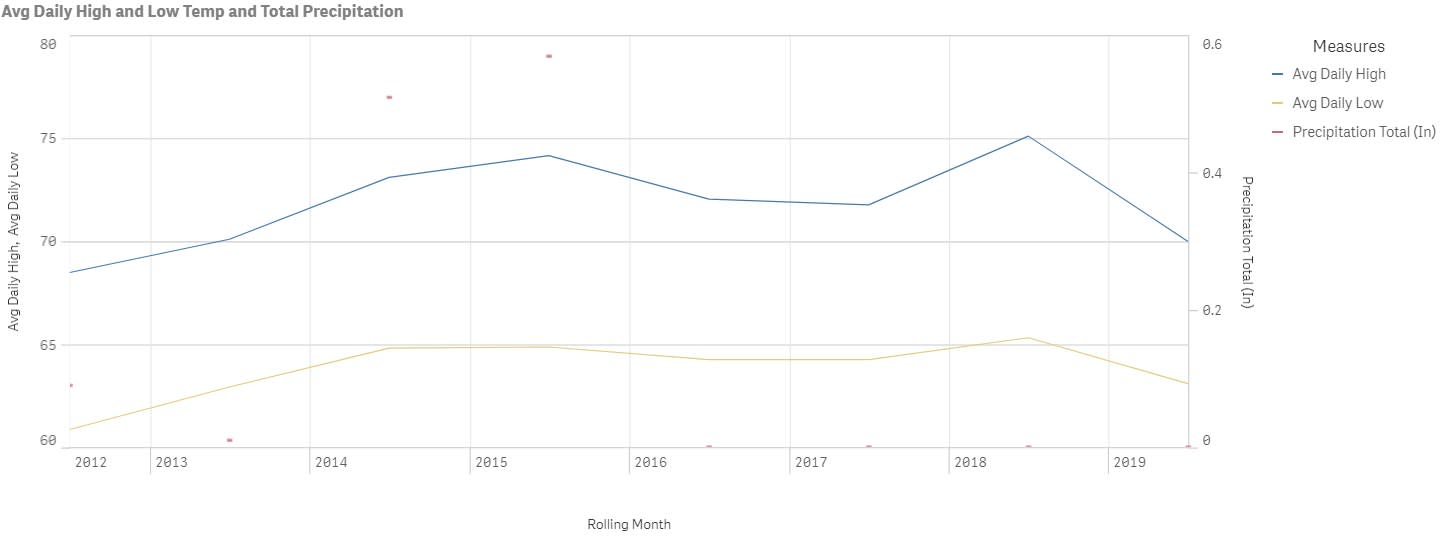
Weather
Year-over-year comparison for highs, lows and precipitation is charted below for the month of July each year back to 2012.
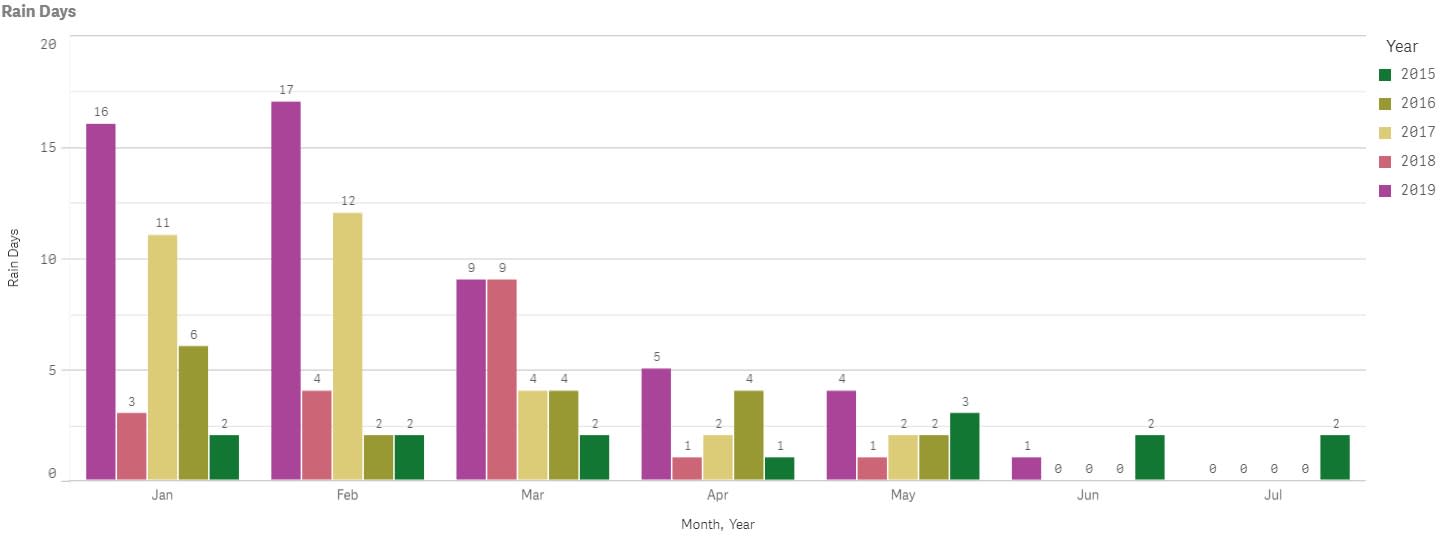
The number of rain days by month for the past five years is charted below. 2019 represents the most rain days year-to-date with 52 days recorded. Both 2018 and 2016 Year-to-date =18 days, 2017 = 31 days and 2015 =14 days.
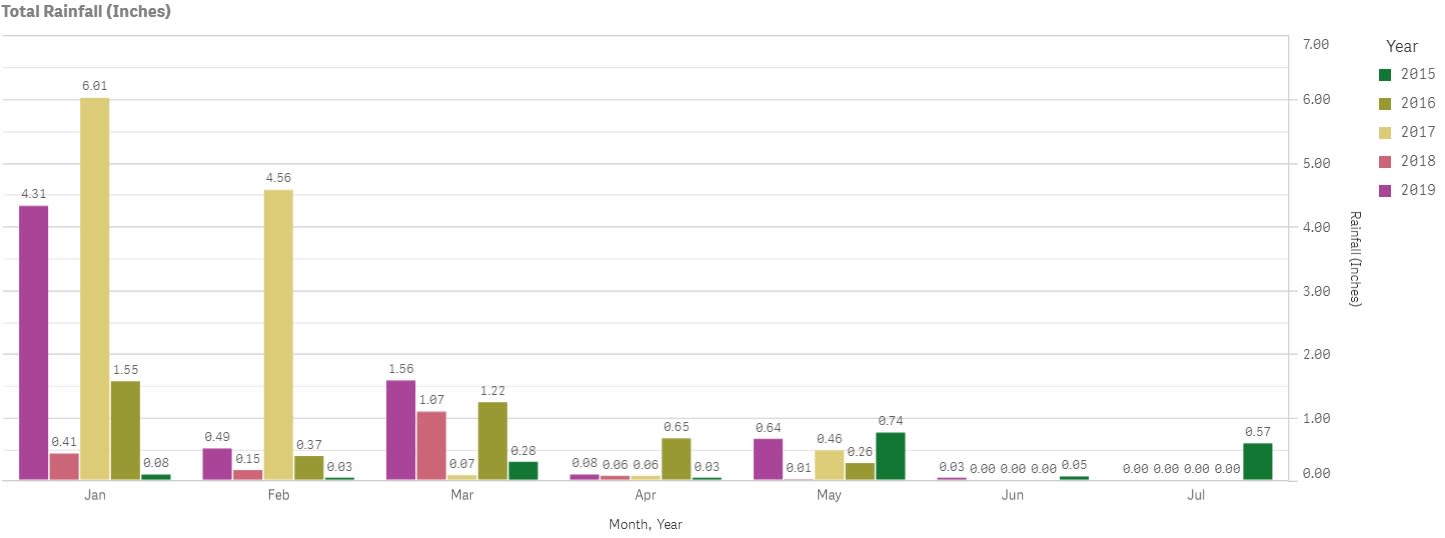
Avalon Rainfall is charted below for the same time periods.


Catalina Flyer from Newport
$10 Off Catalina Island Ferry
Hop onboard the Catalina Flyer for daily ferry service from Newport Beach to Avalon, Catalina Island in just over 1 hour.

Catalina Sea Spa
Recharge with massages starting at $110.
Discover Bliss at Catalina Sea Spa! Book online or call 310-510-8920. Treat yourself and escape to relaxation today!

